What to Know About the Current Ratio
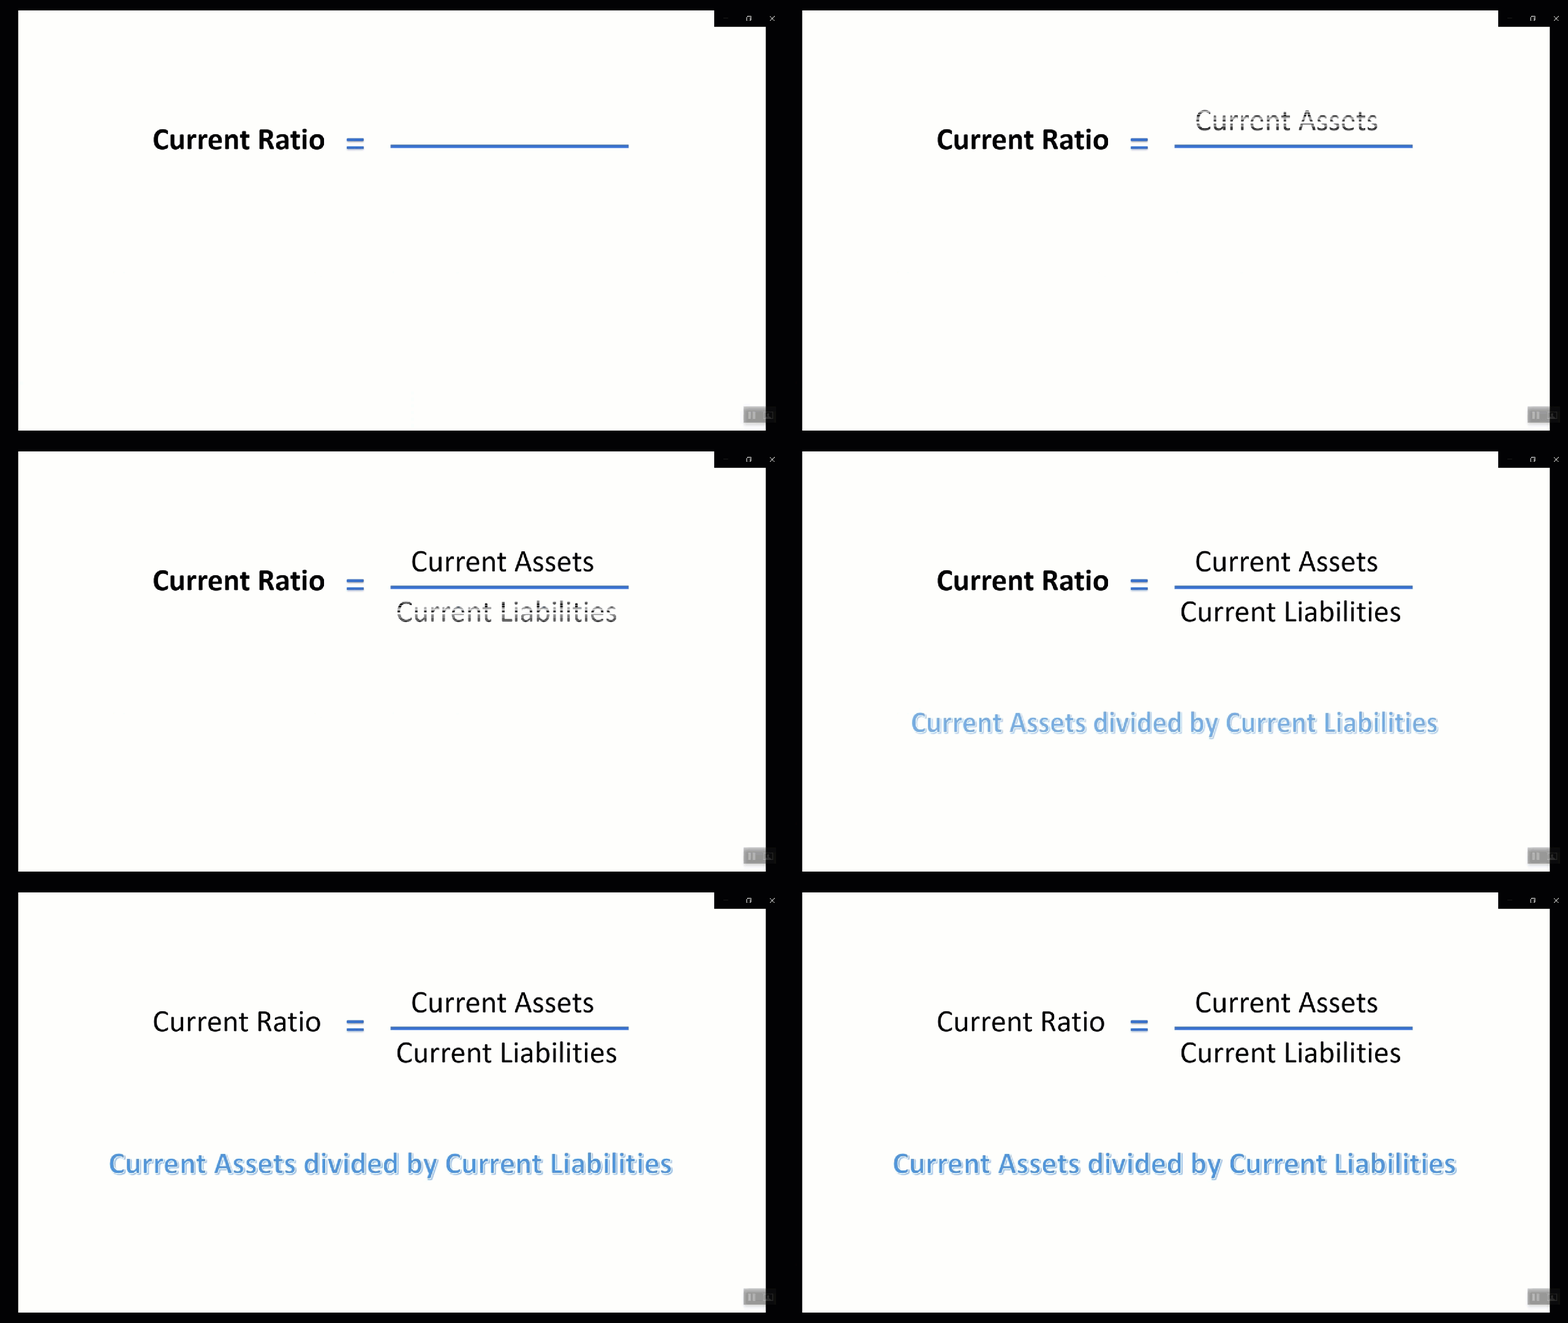
On the surface, the current ratio is a simple calculation. You take the current assets and divide it by the current liabilities. Dig deeper, though, and you'll find there is more to the picture. Learn what to know about the current ratio.

Summary
Source: Balance Sheet
Type of Ratio: Liquidity
Strength of Ratio: Weak to Medium
Meaning: The Current Ratio indicates how easily a company could meet its short-term obligations if faced with a slowdown in its business.
NOTE: This tutorial is part of the One-Topic Tutorial Series! It serves as a quick reference for the topic.

Details
The Current Ratio helps analyze whether a company can meet its short-term obligations. Current assets are those that can be sold or liquidated within a year or less. Current liabilities are obligations that come due in a year or less. Therefore, if you have enough current assets to use to pay off the short-term obligations, you'll live to see another day, if you will.
Consider this indicator as one where you assume the company has run into a slowdown with its business. In other words, should the company experience a slowdown, can it pay off the short-term debts without having to scramble to find cash.
If you can answer yes to this question, then the company can weather the storm.
The Current Ratio Can Be Deceptive
Ratios should never be interpreted as a standalone measure. The current ratio can determine liquidity, but for an extremely strong company, it's almost meaningless. For instance, a company with a great credit rating, can secure a short-term loan to get through temporary slowdowns.
It would make sense for a solid company to borrow money to pay off short-term obligations rather than sell off assets that may be used to generate cash for the future.
Or, even when a company has cash or marketable securities, it still could make sense to borrow short-term, if the return they expect to receive from using the cash will yield a return greater than the interest paid on the borrowing.
Another reason the current ratio may not tell you much is that the company could be a day or two away from getting the cash from their sales. Balance sheets are a snapshot but they don't give you an indication of when the company will be paid.
You can look for inventory turnover ratios and receivable turnovers to better determine a business cycle. But, you'd need to track this as an average over several years.
Example
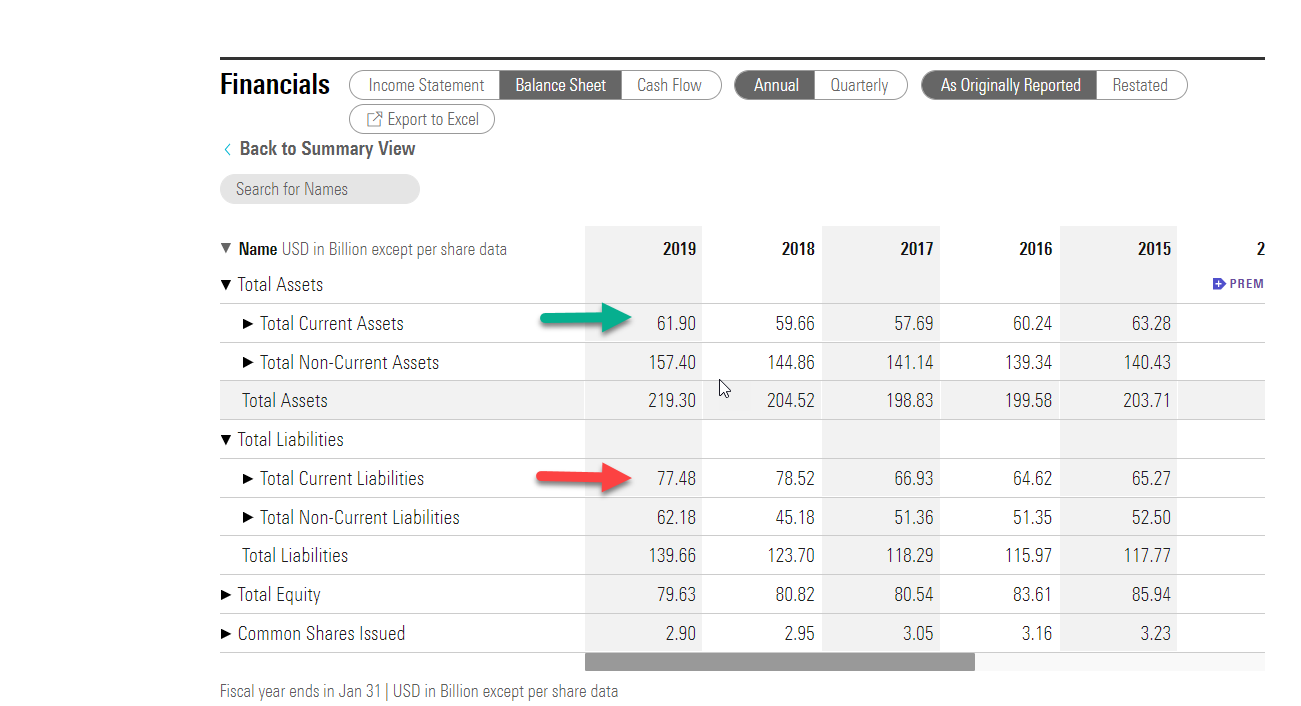
I'll use Walmart as an example. For the fiscal year 2019, the current ratio is as follows (numbers in USD ($) billions):

Source: Morningstar.com
Current Assets: $61.90
Current Liabilities: $77.48
Current Ratio: ~ 0.80 (rounded)
Example Analysis
The numbers for Walmart suggest that it would have a difficult time paying its short-term obligations. After all, the current liabilities are greater than the current assets. However, do you believe that Walmart is in trouble?
In reality, Walmart has clout. First, Moody's rated the company as Prime-1 commercial paper. This means they could obtain short-term financing easily. Second, the company can push out paying suppliers and force its customers to pay sooner. This means it can hold onto cash longer and receive it quickly.
Bottom Line
The Current Ratio has limited value in an analyst's toolbox. It can be useful when comparing the ratio of one company with another in the same industry or sector. But, as the Walmart example shows, using the ratio in isolation will lead you to come to the wrong conclusion.

