
If you’ve ever built a Discounted Cash Flow model in Excel, you already know there are many ways to do it. Some spreadsheets have hundreds of formulas across dozens of tabs. Others pull data from multiple sources and require manual cleanup before you can even begin valuing a company.
That’s why I built this project. I wanted a program that could deliver a quick valuation without spending several days combing through assumptions. Many DCF assumptions can be questionable, especially when the model creator does not explain their reasoning.
The site owner may receive a commission on a purchase made through the links on this page, at no extra cost to you.
Instead of a sophisticated DCF model, I built a solid foundation that is easy to understand and modify. It’s transparent enough that you always know where every number comes from.
If you aren’t a Python coder, don’t let that stop you. You can easily expand it using AI-assisted coding. Whether you use Claude, ChatGPT, Gemini, or another coding assistant, this project gives you a strong baseline to customize to your investing philosophy. Both Claude and ChatGPT can quickly get you set up with the right tools.
The complete source code is available on GitHub:
https://github.com/techhound/streamlit-dcf
Why Keep the Model Simple?
Keeping the model simple makes it easier to understand. I don’t want to spend hours bit-fiddling with a bunch of assumptions that are only going to be challenged anyway (which they should be – that’s okay). But I’d rather come up with a defensible model and include upfront disclosures that the model is simple, so the user gets something practical and easy to trust.
Since I am making it publicly available, I also wanted to ensure that it could be easily changed by anyone who wished to do so, so the project remains useful to more people.
This isn’t going to be the final version, either. My goal is to keep expanding it while keeping this initial branch for anyone who wants to start from it, so it stays a useful starting place.
Where the Financial Data Comes From
This version of the application was built around Excel exports from Stock Analysis. Because I do not have permission to publish data from Stock Analysis, I have included a template showing what the spreadsheet contains.
For the month of July only, I have gotten Stock Analysis to agree to a free trial and 20% off. Use CHARTS coupon code at checkout. Here is the link:
https://financialmarketseducation.com/StockAnalysisFT
Inside the repository is a folder named data_format_template, which contains an Excel workbook called SA Template.xlsx.
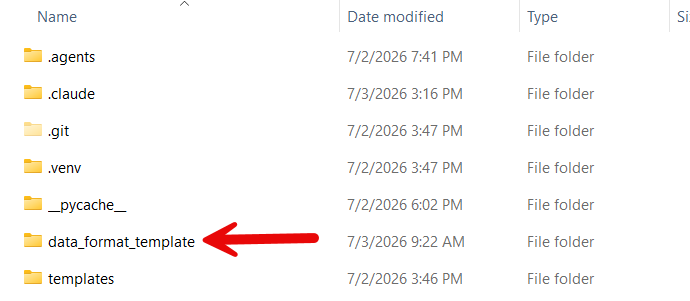
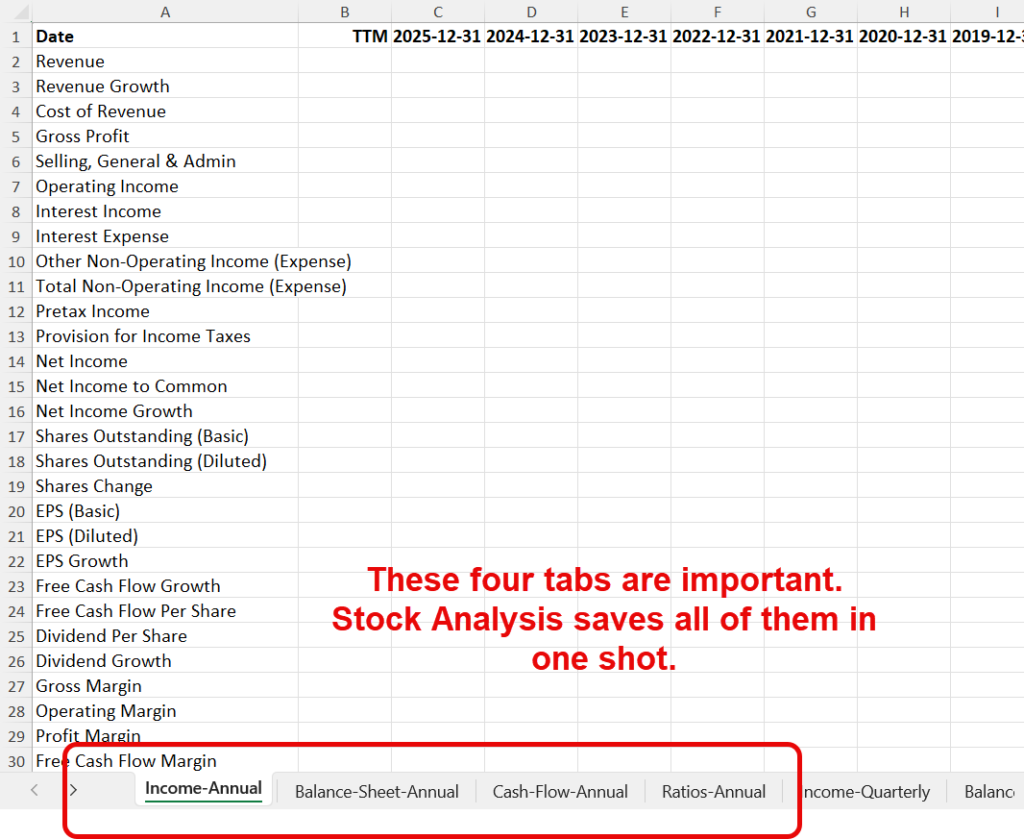
The spreadsheet doesn’t contain any company data. Instead, it contains the worksheet names and column headings the application expects when reading a Stock Analysis export.
I have worked with several data providers over the course of my career. Within the past year, I discovered Stock Analysis. The company provides a lot of data at an affordable price. Furthermore, the type of DCF analysis I use (and model in this program) provides all the data points I need. That is the main reason why the Stock Analysis is the template.
You’ll need a paid version of the service to download data, but the good news is that for July, I have secured a great discount I can pass on to you.
Stock Analysis shows revenue, operating cash flow, capital expenditures, debt, cash, share price, and several other key items, all organized in a clean, consistent format, serving as an efficient starting point for automating the valuation process.
For the month of July only, I have gotten Stock Analysis to agree to a free trial and 20% off. Use CHARTS coupon code at checkout. Here is the link:
https://financialmarketseducation.com/StockAnalysisFT
If you prefer another provider, AI is especially useful here. Provide your alternative spreadsheet to your coding assistant of choice, along with the included SA Template.xlsx file, and ask it to modify the data loader for the new format. In many cases, that is enough.
Of course, with the price so low (Coupon Code: CHARTS) and a free trial if you sign up during July, you really have nothing to lose.
For the month of July only, I have gotten Stock Analysis to agree to a free trial and 20% off. Use CHARTS coupon code at checkout. Here is the link:
https://financialmarketseducation.com/StockAnalysisFT
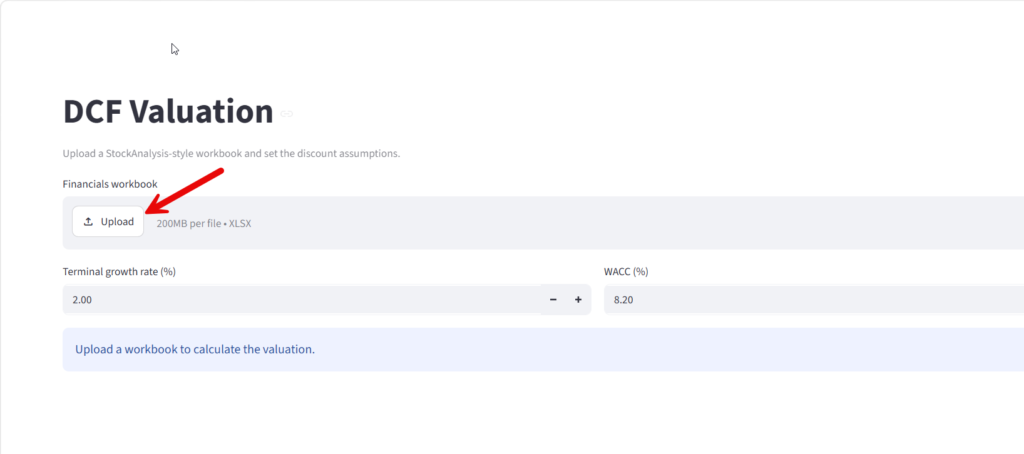
The Inputs
I wanted a model that keeps the number of user inputs to a minimum. You’ll enter two primary assumptions before running the valuation, so the workflow stays fast and focused:
- Weighted Average Cost of Capital (WACC)
- Terminal Growth Rate
Once your financial statements are loaded, the application calculates the company’s historical five-year revenue CAGR and uses that value to populate the initial growth assumptions. This gives you a starting point before you review or edit anything.
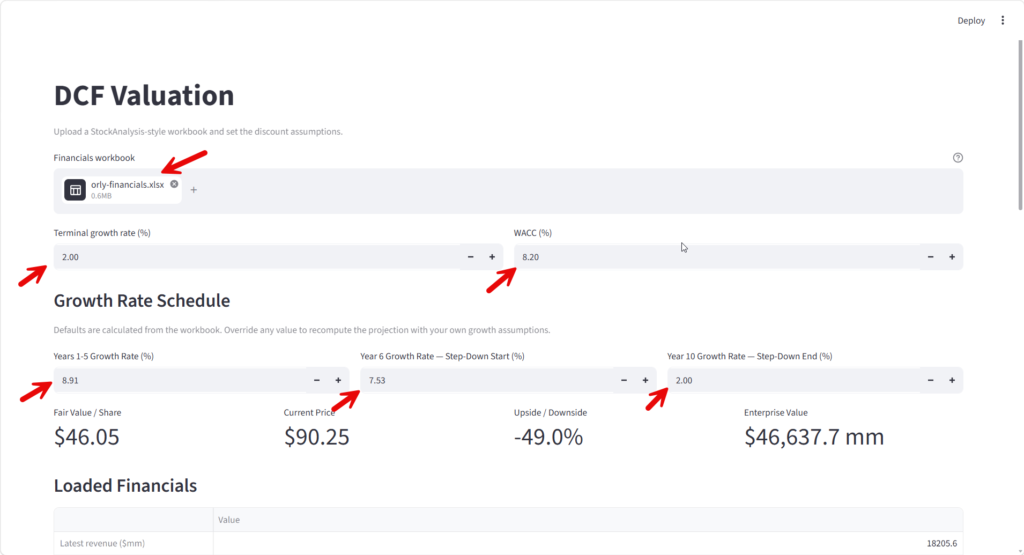
Those growth rates remain fully editable. If you disagree with the calculated values, replace them with your own assumptions. This gives you the convenience of automation while keeping you fully in control of the valuation.
How Revenue Is Projected
Revenue projections begin with the company’s historical five-year compound annual growth rate. By default, that growth rate is applied during Years 1 through 5. Beginning in Year 6, growth gradually declines toward a reduced long-term rate through Year 10. Rather than dropping abruptly from one growth rate to another, the application creates a smooth transition, making the forecast easier to follow.
You can also override these values entirely. To assume the company grows at the same rate for all ten years, enter the same percentage for every growth input. For a steeper slowdown, adjust the Year 6 and Year 10 values. Nothing is locked, so you can tailor the model to your own view.
Free Cash Flow
The model uses one of the most common definitions of Free Cash Flow:
Operating Cash Flow minus Capital Expenditures
The application then calculates the company’s Free Cash Flow Margin by dividing Free Cash Flow by Revenue. That most recent margin is applied to projected revenue throughout the forecast period, keeping the valuation in line with the company’s current cash-generation profile.
This keeps the model straightforward while still tying projected cash generation to expected business growth. Future versions may support changing margins over time, but I wanted the baseline version to stay as easy to understand as possible, so it remains immediately useful.
Discounting Future Cash Flows
Once projected cash flows have been generated, each year’s cash flow is discounted to present value using your selected WACC. This reflects a basic principle in finance: a dollar received ten years from now isn’t worth as much as a dollar received today. Discounting converts future cash flows to present value so they can be summed into a single estimate of enterprise value.
Calculating the Terminal Value
No DCF model can forecast every future year individually. Instead, after the explicit forecast period ends, the application uses the Gordon Growth Model to estimate all remaining future cash flows based on your selected Terminal Growth Rate. That keeps the model practical while still extending value beyond the forecast window.
I tend to favor a conservative terminal growth assumption, since it’s easier to defend over long horizons. That said, there isn’t a universally correct answer; different investors use different assumptions depending on their philosophy and the company they’re analyzing. That’s why the application lets you change it with a single input.
From Enterprise Value to Intrinsic Value
After the discounted cash flows and terminal value are combined, the application adjusts for the company’s balance sheet. Cash is added, and debt is subtracted, producing an estimated equity value. Finally, the application divides that value by the number of shares outstanding to estimate an intrinsic per-share value, providing a usable metric for comparison.
Built to Be Modified
I’ve set this project up so that you can easily make changes manually or with AI. Maybe you’d prefer analyst estimates instead of historical growth, want to project operating margins separately, or add Monte Carlo simulations, scenario analysis, reverse DCF models, or sensitivity tables. Those are all excellent additions, and they make the project even more useful for different investing styles.
Clone the repository:
https://github.com/techhound/streamlit-dcf
With today’s AI coding assistants, you can describe the procedure you want, point the AI at this project, and let it generate much of the code for you. You’ll still want to review and test everything carefully, but AI dramatically lowers the barrier to experimenting with new valuation techniques and tailoring the model to your needs.
Think of this project as a foundation rather than a finished destination, so you can keep turning it into something more useful.
Final Thoughts
Every DCF model is ultimately a structured way of expressing your assumptions about the future. The goal isn’t to discover the one “correct” intrinsic value; it’s to build a model that’s transparent, logically consistent, easy to defend, and genuinely useful for decision-making. Hopefully this project gives you exactly that. If nothing else, it should save you from rebuilding the same spreadsheet over and over again while giving you a flexible starting point you can keep improving as your investing knowledge grows.


Be First to Comment