Google Sheets for Financial Statement Analysis
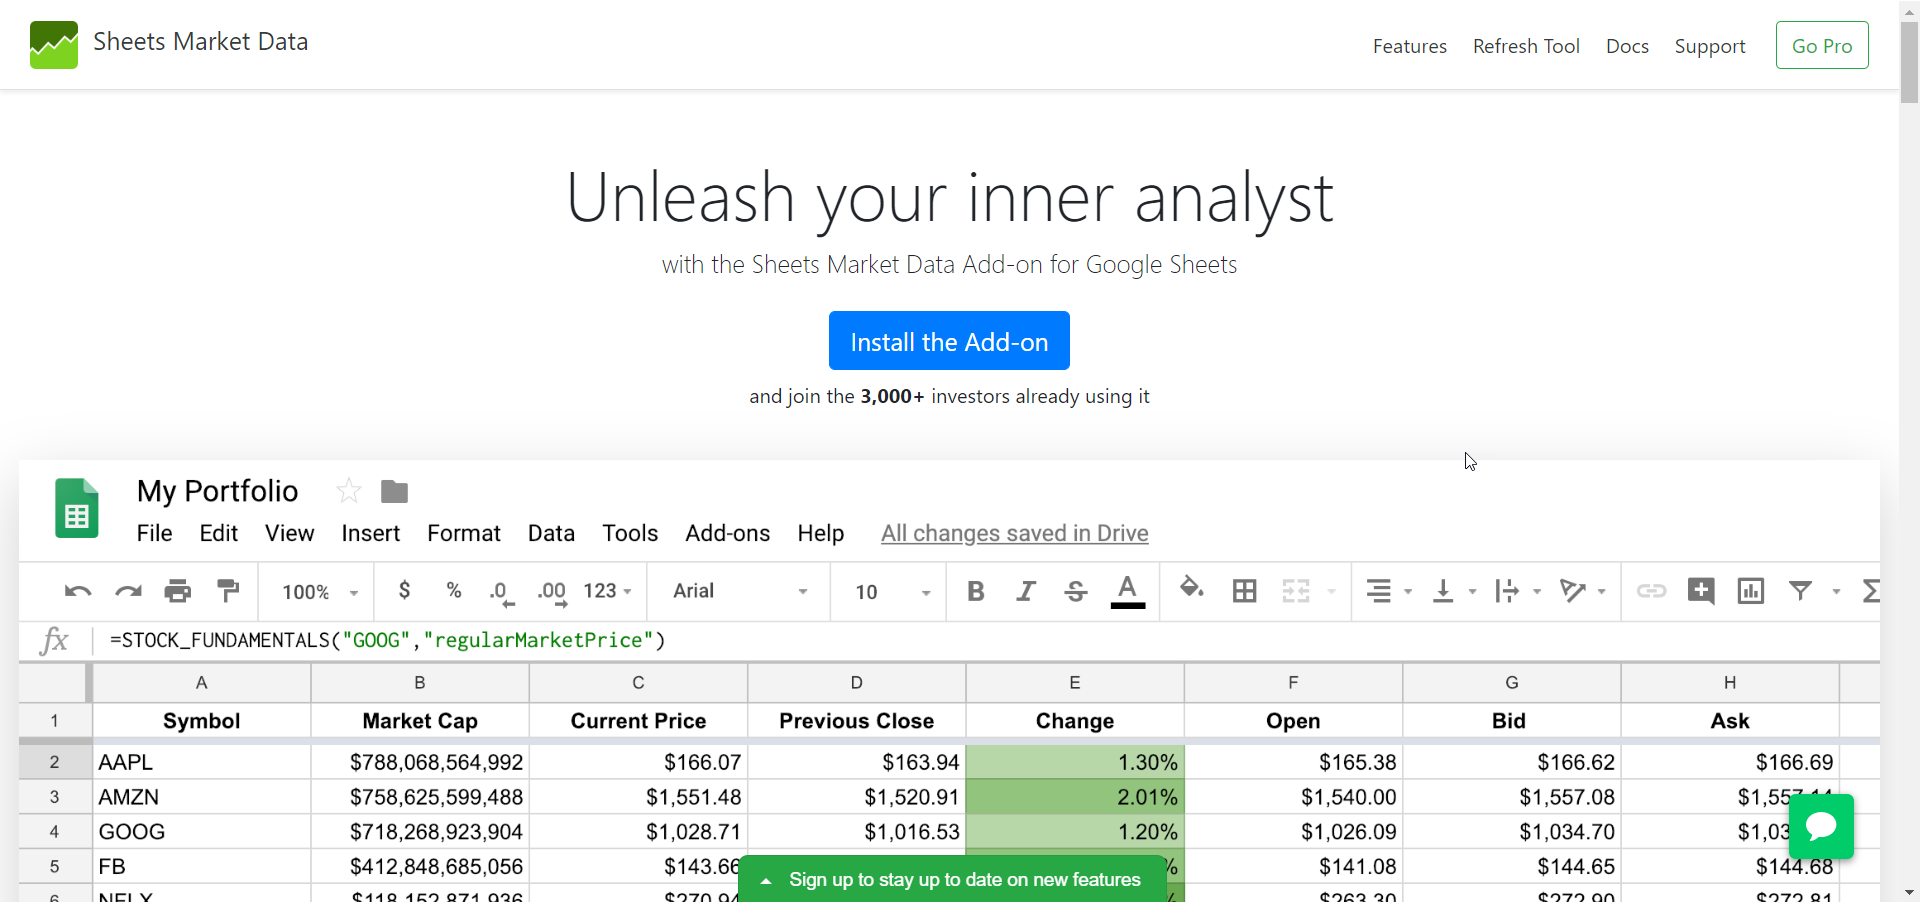
Did you know that you can use an add-on for Google Sheets for financial statement analysis? Google Sheets does contain a function to obtain financial data, but it's limited in what it returns. In this article, we'll explore an add-on that can be beneficial in this type of analysis.
Why Google Sheets for Financial Statement Analysis?
Defining the Data Points for Analysis
Where to Find Tutorials on Financial Statements
About the Sheets Market Data (SMD) Add-On
Create Ratios and Other Formulas Based on Desired Data Points
What About Financial Statement Analysis Ratios?
UPDATE: As of December 1, 2019, Sheets Market Data (SMD) is being discontinued. The sections that use this addon will no longer work. I am looking for possible replacements or to write another article with alternatives methods.
Why Google Sheets for Financial Ratio Analysis?
I am not about to bash Microsoft Excel. It's a great product that has withstood the test of time, and with good reason. It offers sophisticated functionality that is often perfect for financial analysis.
The program is not free, however. When financial analysts travel on business, they may not have access to Excel. Even when they do, the add-ins they use on their regular installations may not be installed. Then, there is the issue of having access to the spreadsheets they created.
You may be thinking why they wouldn't simply bring their laptops with them when they hit the road. The problem is that laptops get stolen easily. Big companies are prohibiting employees from bringing laptops with sensitive data on business trips.
When Google Sheets (GS) first emerged, it didn't have the functionality that most financial analysts needed. This made it difficult for financial users to adopt GS. However, the gaps in functionality have narrowed, and it is feasible for many financial analysts to use it with confidence.
What makes GS so special? Functionally, not much. It's similar to Microsoft Excel in that regard. But, the biggest advantage is that the software is cloud-based. If you travel, it's ready for you to use. You simply sign into your Google account and you have everything available to you.
Microsoft does offer cloud-based storage for Office 365 users. While that is helpful, it does not address the lack of Excel software when business users travel.
Microsoft and Google are fierce competitors. It's likely they will play off each other when defining future releases of their software. One most users won't recognize the difference between the two solutions and they will be interchangeable. That is how competition works.
This article focuses on GS only and in particular, an add-on for GS that allows the downloading of financial statement analysis data for companies.
Caveat: to get the most out of this tutorial, the add-on discussed requires a monthly subscription. The company does offer a 5-day trial, however. UPDATE: Discontinued (See Note in Beginning)
Defining the Data Points for Analysis
The first step is to define which data points to work with for your analysis. For the purposes of this article, we'll only select a few key points. Specifically, we'll consider the current ratio, debt-to-equity ratio, and the forward earnings per share (EPS).
This article is not a tutorial on financial statement analysis. That would bloat the article and it would become painful to read. Besides, there are plenty of tutorials available that can fill in the knowledge gaps. Novice financial analysts (beginners) can get something out of this tutorial, but it would be helpful to have an understanding of financial statements beforehand.
Where to Find Tutorials on Financial Statement Analysis
A simple Google search on the term 'Financial Statement Analysis' will return a wealth of information. Add the word 'tutorial' to it and you'll get a more refined result set. However, there are a few resources that I have found helpful and will pass these along to you.
Resources
Financial Statement Analysis from Accounting Tools
Analysis of Financial Statements from the Corporate Finance Institute
Financial Statements from Accounting Coach
12 Things You Need to Know About Financial Statements from Investopedia
Practical Oriented Analysis of Financial Statements from Udemy
Here is a good intro to Accounting Basics:
DISCONTINUED as of December 1, 2019!!!!
About the Sheets Market Data (SMD) Add-On
As a computer programmer and an investor/trader, I have searched far and wide for a data feed that offers financial statement data. When I was learning the statistical programming language R, I discovered a package called Quantmod, and this package contained stock prices as well as financial statement data. The data was supplied by both Yahoo Finance, and Yahoo.
I thought I had everything I needed and then both Yahoo and Google pulled the plug on financial statement data feeds. The Quantmod library still (to this day) returns stock market prices. But, no longer does it return fundamental data from the financial statements.
I put the project of obtaining financial data on hold at that point. Recently, I was reading about how Google Sheets has a built-in function called GOOGLEFINANCE that could be used to retrieve financial data. My thinking was that it would include financial statement data, but it doesn't.
It did pique my interest in finding something that would return this type of data. That is when I discovered Sheets Market Data. It's an add-on for GS that provides more function than GOOGLEFINANCE. The add-on is free to doanload. However, the free version, while being more robust than GOOGLEFINANCE, does not return financial statement data.
I investigated the price of the add-on and learned that it costs $5 per month. For me, that isn't going to break the budget, and it helps me write for this website. I am chalking this up as a cost of doing business, an expense item, if you will.
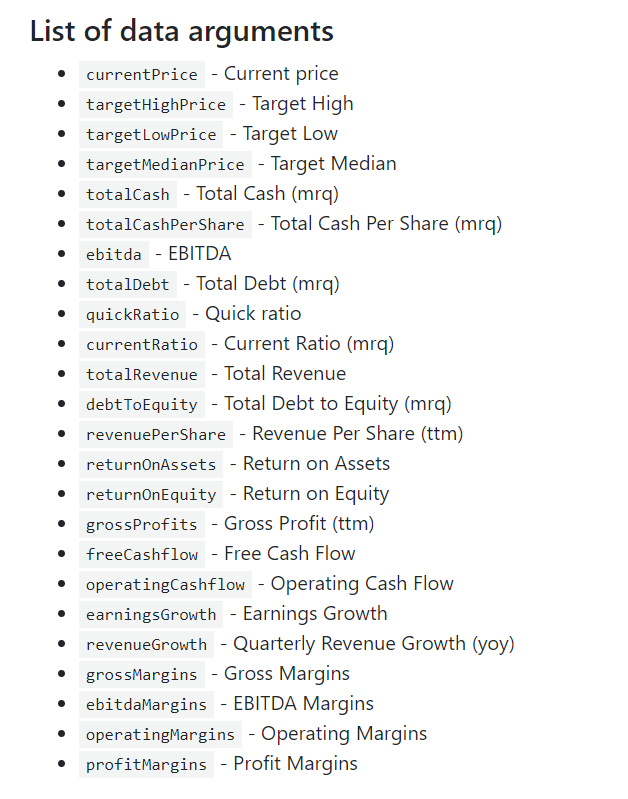
You may find that the functionality included in the free version is enough for your needs. In fact, the three ratios that I am including for this article are contained within the free version. The difference is if you want to calculate the ratios yourself or you want to use information that is not available in the free version, you'll need to upgrade.
As you can see from the diagram on the left, there are quite a few functions that are available in the free version. These are useful measurements too. Return on Equity is something almost every financial analyst will want to track. Margins are another useful data point.
Obtaining Data From SMD
For now, I am going to assume you are not going to upgrade to the paid version of SMD. The mechanics of the function calls are similar no matter which version you choose.
As mentioned in the beginning, I am including the Current Ratio, Debt-to-Equity, and forward EPS. Let's go over each:
Current Ratio
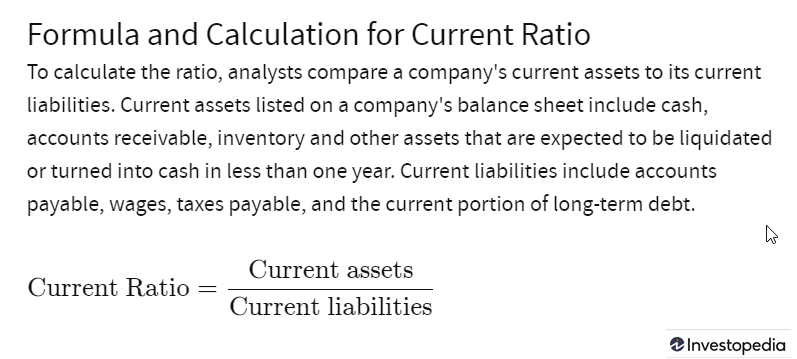
Investopedia defines the current ratio as:
To obtain the current ratio in SMD, you can use the STOCK_FINANCIAL_DATA command. The syntax is as follows:
=STOCK_FINANCIAL_DATA(symbol, 'currentRatio')
If you wanted to get this information for Facebook (Symbol:FB) let's say, you would enter:
=STOCK_FINANCIAL_DATA('FB', 'currentRatio')
At the time of this writing, the current ratio as defined by SMD is 4.65.
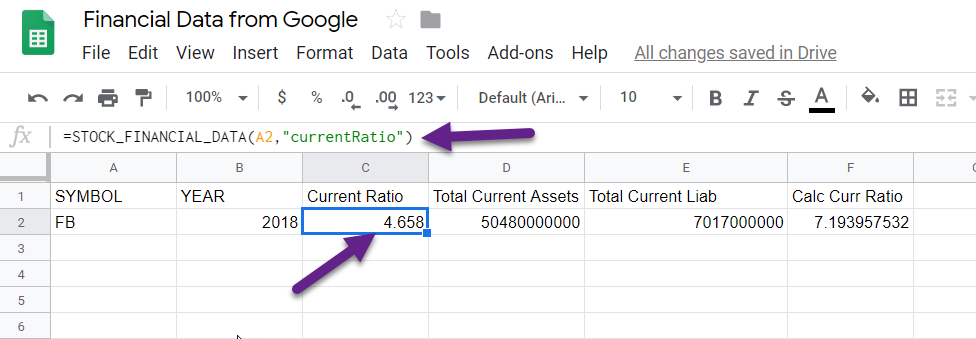
Is this correct? Yes (explanation below). I checked with Morningstar for Facebook and it is reporting a value of 4.66 which is right where we want the number to be.
However, when I use the Pro version of SMD, the components that make up the current ratio as defined by Investopedia are as follows:
Total Current Assets = 50.48 (in billions of dollars)
Total Current Liabilities = 7.02 (in billions of dollars)
Note: these numbers coincide with Morningstar's data for 2018.
As you can see from the GS screenshot above, the calculated current ratio is quite different from the reported value from SMD. Yet, the value coincides with the reported value in morningstar.
Why the big difference?
According to Morningstar's definitions, current ratio is defined the same as Investopedia, i.e., current assets divided by current liabilities:

The difference is due to the reporting period. The current ratio that Morningstar reports is for the current quarter, which at the time of writing is Q3 2019. The numbers match all around. It's just that you have to realize the difference in reporting periods when dealing with these numbers.
Create Ratios and Other Formulas Based on Desired Data Points
Earlier in the process, you would have defined what data points you are interested in pulling from the SMD add-on. For simplicity, I have chosen three easy measures: current ratio, debt-to-equity and forward EPS.
When actually using this for your analysis, you'll probably want several more indicators. In some cases, you'll need more indicators than you will for other times. Some indicators you may never use.
Although beyond the scope of this article, you may want to create both horizonal analysis and vertical analysis. This helps you see the data at "different angles" so to speak. It can help you put your data into perspective.
You may use standard ratios or come up with ones that make sense to you. There are no rules that you are required to follow (unless your boss is making the rules.) You may want to disclose which assumptions you are using in your models, though. Otherwise, people will be confused when referring to custom numbers.
What About Financial Statement Analysis Ratio Categories?
When you plan out your data acquisition strategy with SMD, you can decide to break out ratios by their categories. The following are common categories for these ratios:
- Liquidity Ratios
- Leverage Ratios
- Profitability Ratios
- Efficiency Ratios
- Market-Value Ratios
You may find different categories or different descriptions given for these categories. This likely has to do with the fact that ratios can fit into more than one category.
More About the SMD
As discussed, Sheets Market Data (SMD) is a add-on for Google Sheets. This add-on has functionality that pulls market data from Google and places that data into GS cells that you specify. While it is convenient, it does have limitations:
- Yearly Financial Statement Data only. If you analyse your financial data for quarters, SMD won't help you with this functionality.
- Many of the predefined ratios returned from SMD are the latest quarter. While that can be helpful, it won't be if you need data from earlier periods.
- If you plan on trading from the data return by SMD, do so at your own risk. It's not a bad idea to double check with the official source of data, i.e., the Securities and Exchange Commission (SEC). Companies are required to file with this agency, so the data is likely to be more accurate.
- There are daily limits to how much data you can retrieve. This is a Google restriction, however, not the creators of SMD.
- Financial statement data functions (balance sheet, income statement, and cash flow) are not included in the basic version of the add-on. You'll need to upgrade to the monthly premium subscription. It's not expensive, but if you have an aversion for paying for add-ons, it won't be a good solution for you.
Tips for Using SMD
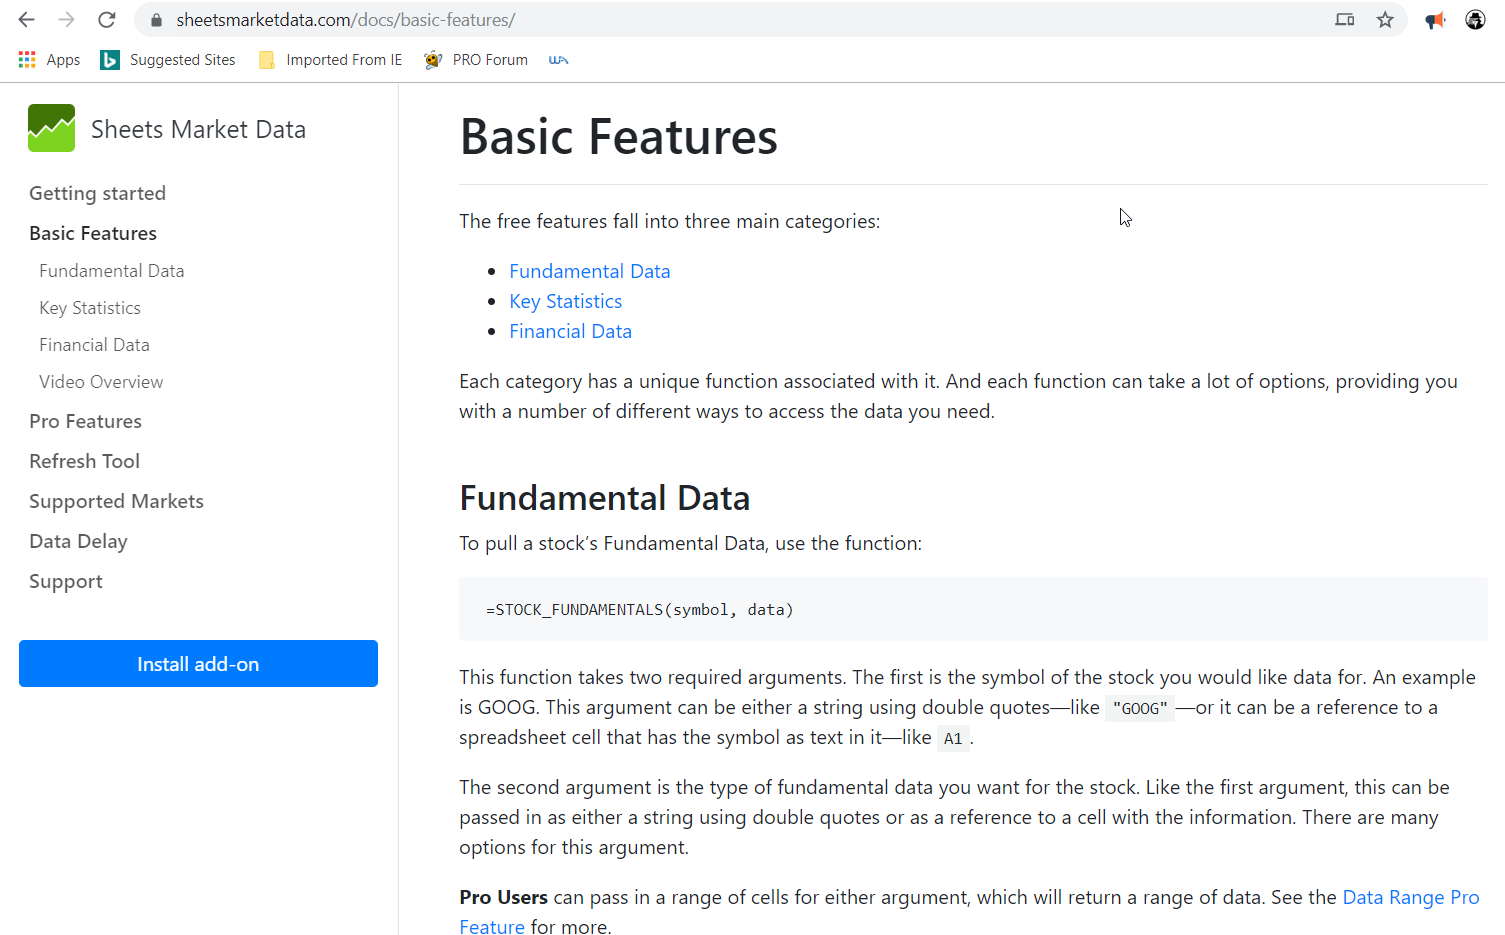
The documentation for SMD is useful and serves as a guide on which functions and parameters to use. I keep a separate tab open with documentation and reference it when I am creating my sheets. The following image is one section of the documentation:
What Types of Financial Ratios to Use?
Volumes of information have been written on financial ratios. There are far too many to give them the coverage they need in this article. This article is more about how to use the SMD add-on to obtain financial data. That much, I believe I accomplished with this article.
The resources I included previously should serve as a good starting point for learning about which financial ratios to use.
If I were pressed to give a quick summary of which ratios to use, my quick list would likely be the following:
- Current Ratio
- Quick Ratio
- Debt-to-Equity Ratio
- Return on Equity
The good news is each of these data points are available in the basic version of the add-on.
Where to Go From Here?
If you can accept the latest quaterly data and the preset data points from SMD, then the basic version may be enough. However, if you'll need the financial statement data, then you will need to upgrade. At the time of this writing, it costs $5 per month. You can get two months free when you pay yearly.
I plan on developing a series on using Google Sheets for analyzing financial statements. The first module will discuss breaking down the Return on Equity components and a discussion on a concept known as the DuPont Framework.

