Reconciling the ROE with an Example
You're a finance person, right? If you're not, why would you be on this website? Maybe you're looking to become a finance person, or maybe you want to get better at investing.
Whatever your motivation for learning finance, you're likely to come across financial ratios. It's not the only financial concepts that you'll work with, but if you're looking to invest, these ratios can be quite helpful when researching stocks.

Financial ratios aren't difficult to learn. It's remembering them and when to use them that's the challenge. They become second nature the more you use them, though, just like anything else in life.
Tying Out the Numbers
Another challenge with financial ratios is trying to determine whether you are applying them correctly. You may read about how to use a ratio in an article. But when you try them out for yourself, the line item that you need in the financial statement is different than what they told you to use in the article.
Publicly listed companies are required to submit frequent financial statements to the Securities and Exchange Commission (SEC). However, there is no standardization for the line items companies use. Sales is the same as revenues, for instance. Earnings and income are often used interchangeably as well.
You'll start to get used to these nuances as you work with these financial statements more. But companies always find a way of tripping people up.
Due to these nuances, you'll need to reconcile many of the ratios that you are planning to use. If you don't get this right, you'll be analysing the wrong data. What you think will be a valid ratio could lead you to making poor investment decisions. Worse, you won't necessarily know why those investments went against you.
You need only tie out the numbers for a company the first few times. If they tie out, you won't have to go through that tie-out process the next time. It's just to give you a confidence that the calculations, in this case the ROE, are correct, initially.
However, it is advisable to tie out different companies. This would require you to find ratios on these different companies along with the analysis. Doing this exercise is a litmus test of sorts.
The attempts to reconcile the numbers don't always go as planned, unfortunately. The ROE is one of those indicators that often causes trouble for people, and they aren't sure why the problems occur.
The good news is this article is going to help you. In it, I discuss about reconciling the ROE with an example.
The main reason ROE causes problems is that it has hidden components to it. The standard format of this calculation is Net Income divided by Equity, which is a factored equation. If you remember from basic math, when a number is the same in the numerator as it is in the denominator, it will reduce to the number 1. Since anything multipled by one is itself, the 1 can be eliminated.
In ROE, there are two instances where the numerator and denominator (of the long form for ROE) calculates to 1, thus elimating these instances. The long-form calculation contains Sales and Assets that appear both in the numerator as they do in the denominator. Thus, these two components are eliminated since they are reduced to the number 1 each.
This factoring process can cause important components of the ROE to stay hidden. I wrote about this in another article here on FME called How Return on Equity is Deceiving You. You'll find this to be an insightful article.
Return on Equity (ROE) for Apple (Real Example)
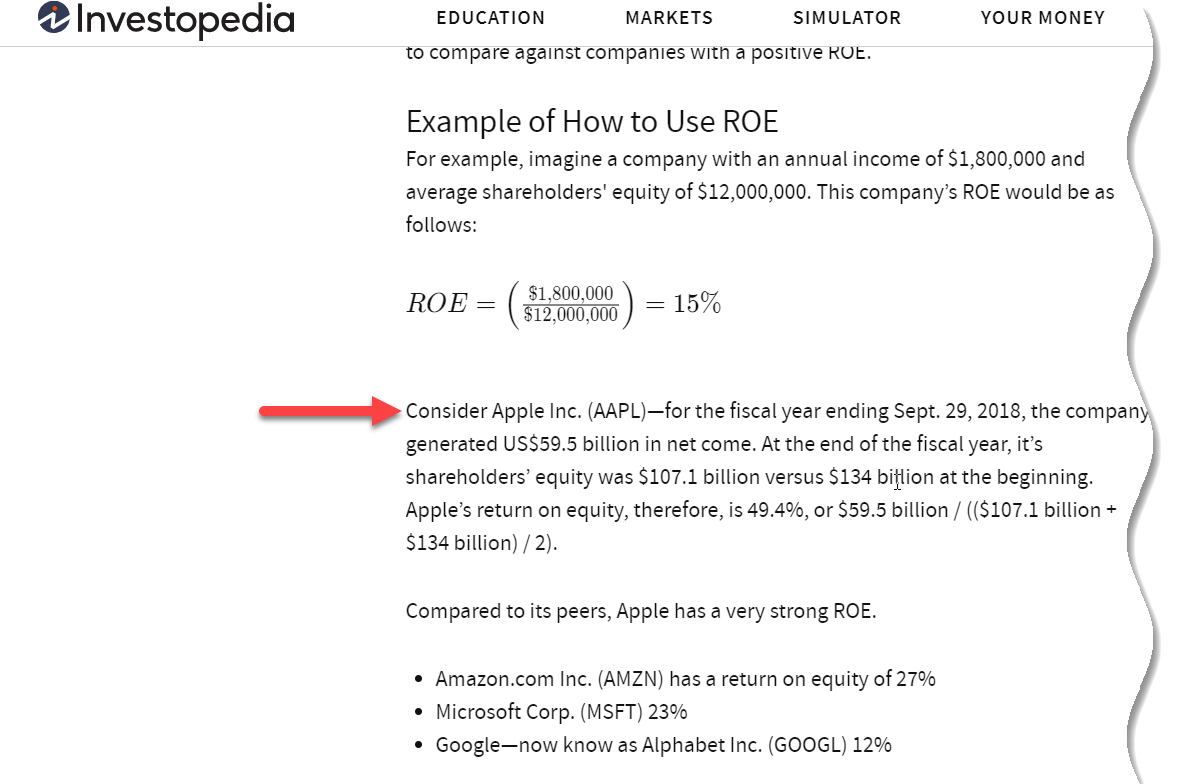
Investopedia is a great website for learning about investing concepts. It's been around for a while and it is one of my go-to resources for reference. It should come as no surprise that I found a decent explanation on ROE. With this explanation was a real example using Apple stock (SYMBOL: AAPL).
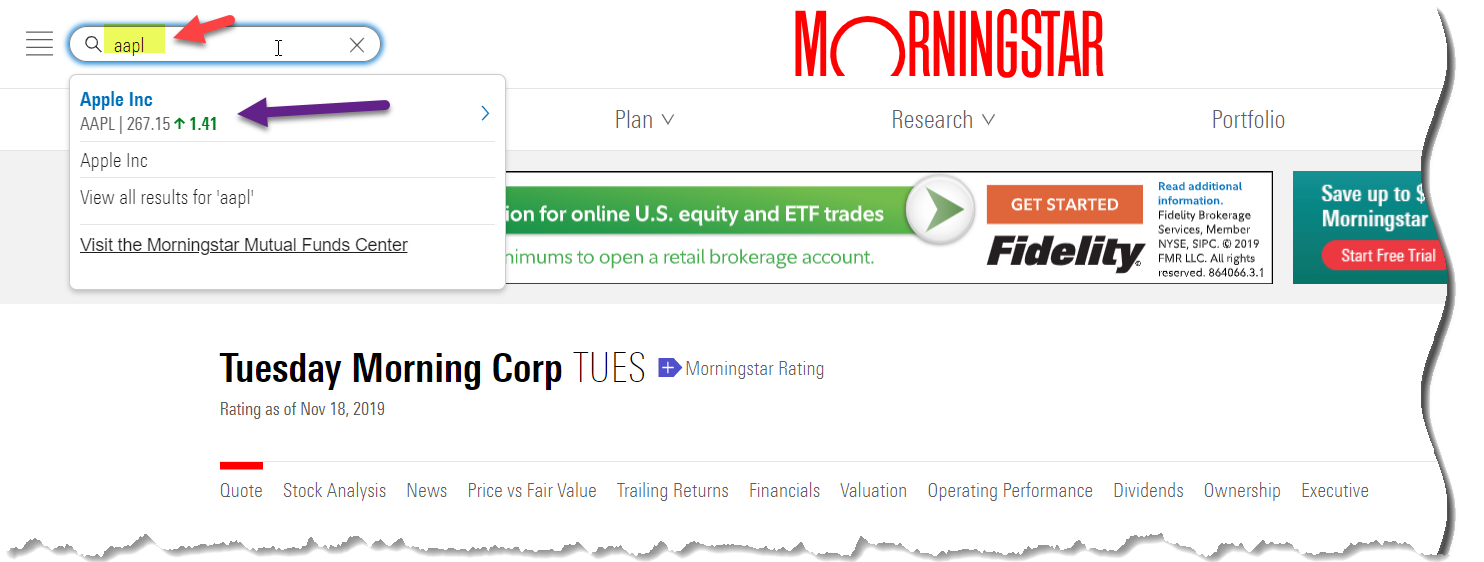
I used Morningstar to obtain the data for the example. The main screen from Morningstar requests a company or a stock symbol. I entered AAPL (symbol for Apple's stock). Either hit <Enter> or select the option for Apple in the drop down list as shown:
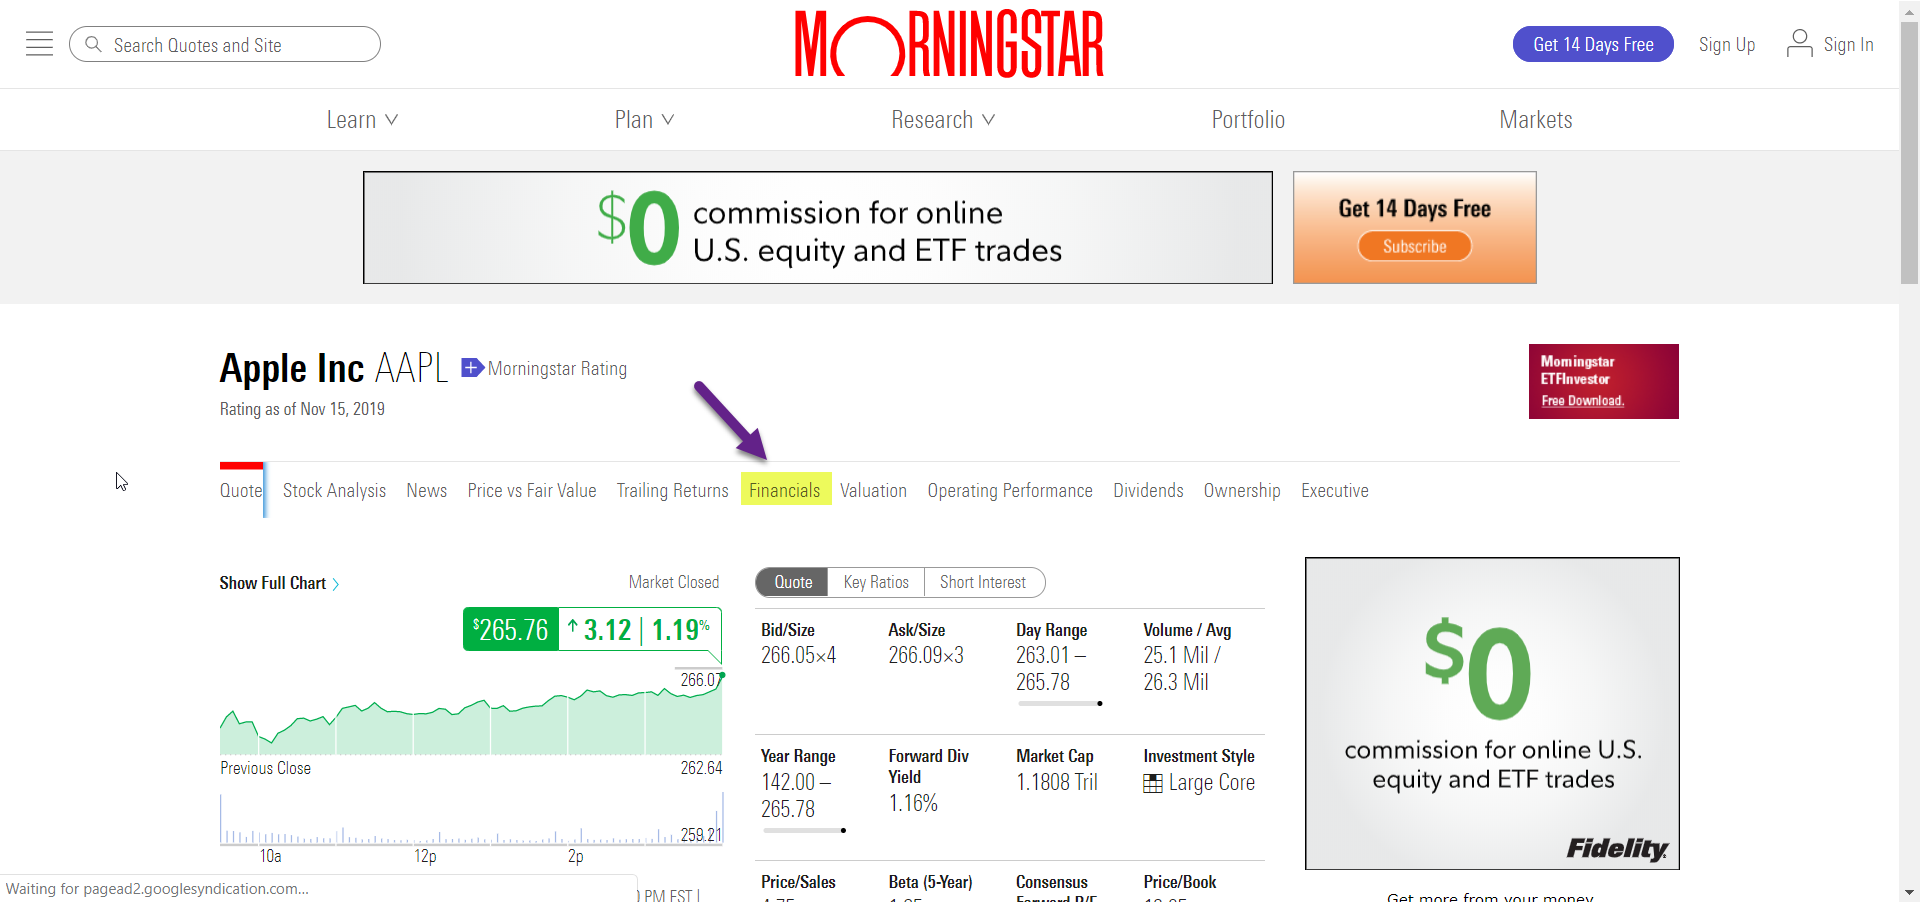
You'll be taken to the quote screen for Apple. The next step is to click on the Financials option:
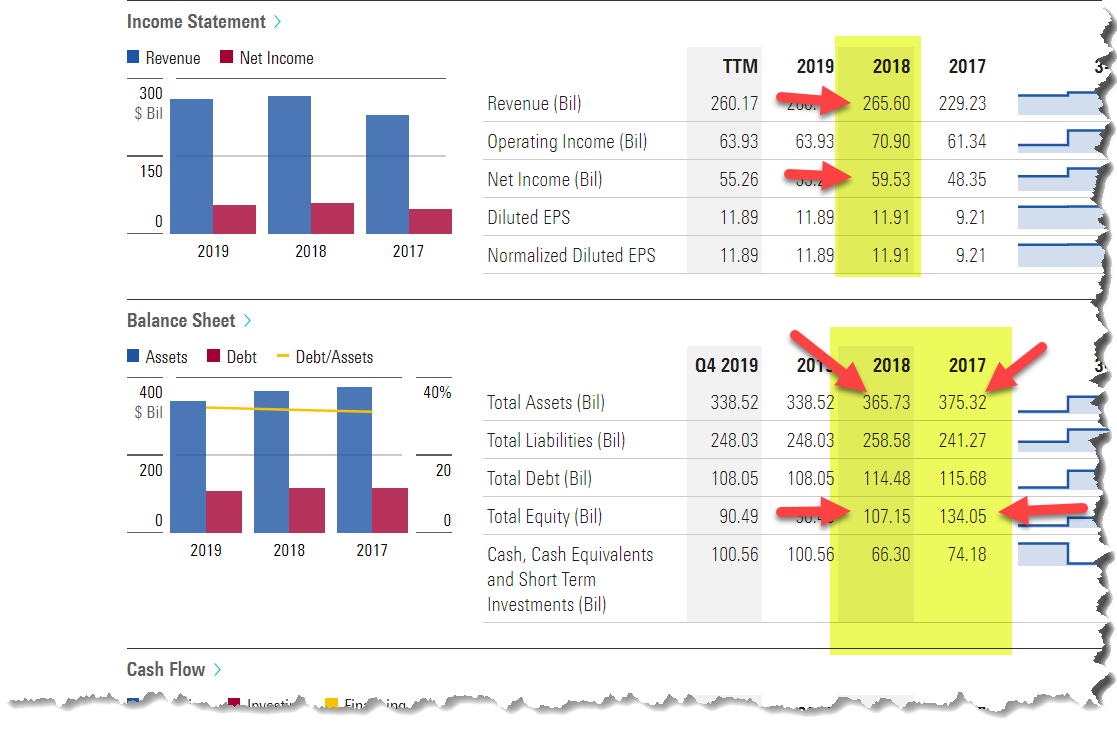
You'll be taken to a summary of the financials for Apple. Scroll down to the Income Statement and Balance Sheet section:
CAVEAT: websites offering free financial data are not always accurate, including websites such as Yahoo Finance and Morningstar. If you find that your calculations seem correct but are not tying out, download financial reports from the SEC (sec.gov) and compare the numbers to these services. These financial websites disclose on their websites that inaccuracies may occur.
Of course, if you subscribe to a paid data service, you should expect the numbers to be accurate. If they are not, you should consider another service!
You'll likely notice that I included information for both 2018 and 2017 for the balance sheet but not for the income statement. Why?
It has to do with the timing of statements. The balance sheet is considered the perpetual records for a company. The income statement, on the other hand, is activity recorded for a specific period and is accumulated for that period. The period is usually quarterly or yearly. At the end of the year, certain components of the income statement are rolled into the balance sheet and the income statement starts fresh the next year.
The balance sheet is a snapshot in time. There is no concept of periods for a balance sheet. Therefore, capturing only the year end amounts for the balance sheet does not reflect activity for the entire year. By taking an average of the beginning of the period (that coincides with the income statement) and the end, it better represents the year and aligns more with the income statement numbers. It's not perfect, but it is better than just using the one number from the balance sheet.
Therefore, the numbers we use from the income statement (Net Income and Revenue) only need the year end figures because they represent the entire fiscal year. The balance sheet items that we need (Assets and Equity) should be averaged as follows:
Avg Assets = (Beginning of year Assets + End of Year Assets) / 2
Avg Equity = (Beginning of year Equity + End of Year Equity) / 2
Note: the Beginning assets and equity can use the end of previous year assets and equity, respectively.
One helpful item that I feel can make the analysis go smoother is to create a spreadsheet and list out the components you'll need to obtain from Morningstar. You could set it up as follows:
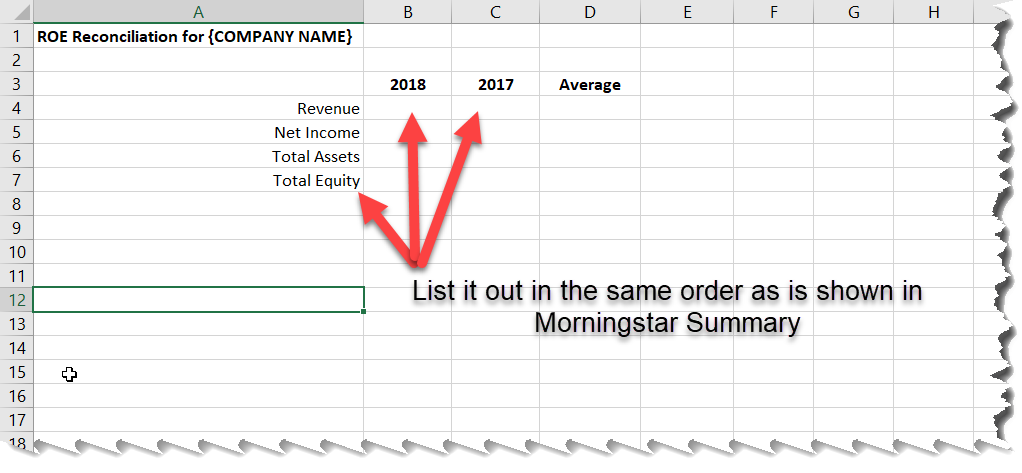
Then, fill in the numbers that are highlighted in the Morningstar Financial summary page. By keeping the order of the labels (Revenue, Net Income, etc.) in the same order as the Morningstar summary page, and keeping the years (2018, 2017) in the same order, you can easily find and record the numbers.
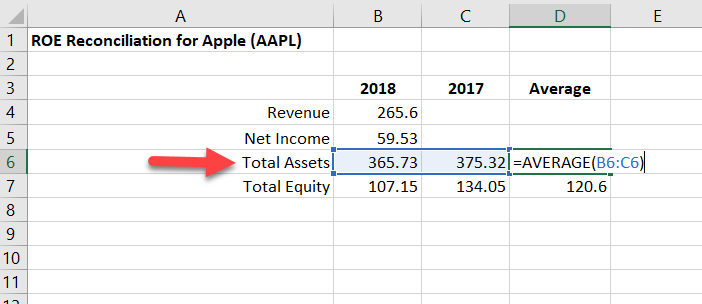
After you enter the numbers, you can average the Total Assets column:
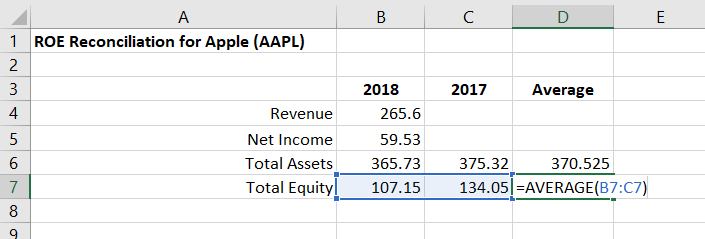
Then, average the Total Equity column:
At this point, you have all the components to tie out to the ROE for Apple. Even better, the way that is shown here gives you the constituent parts for the DuPont Framework.
I've set the spreadsheet up as follows:
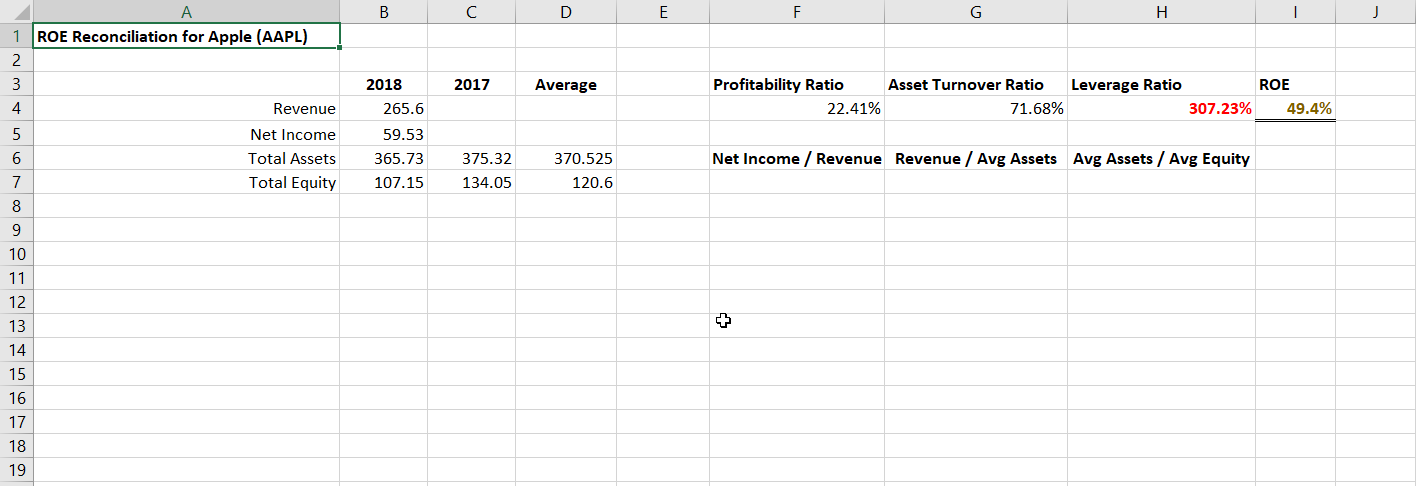
To recap, here are the calculations:
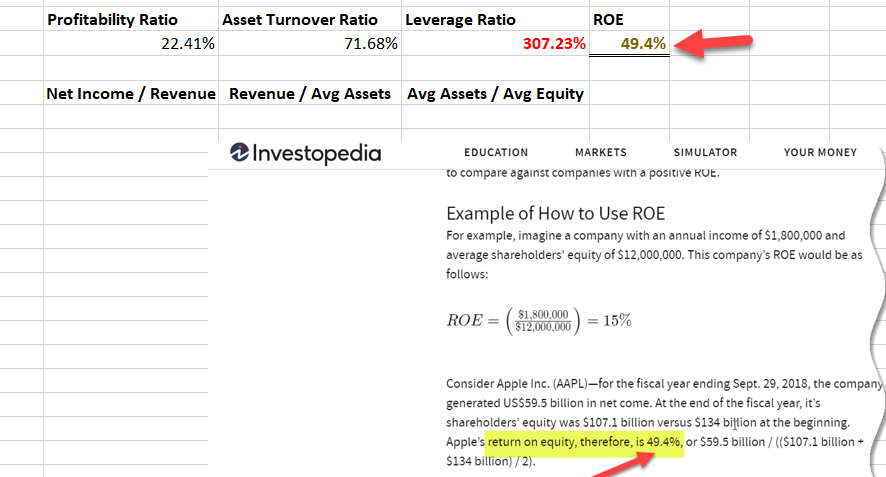
Profitability Ratio = Net Income / Revenue = 59.53 / 265.6 = .2241 = 22.41%
Asset Turnover Ratio = Revenue / Average Assets = 265.6 / 370.525 = .7168 = 71.68%
Leverage Ratio = Average Assets / Average Equity = 370.525 / 120.6 = 3.0723 = 307.23%
When you multiply these three components,
22.41% x 71.68% x 307.23%
This results in the ROE of 49.4% which is what Investopedia came up with:
DuPont Analysis
You could have arrived at the same ROE number by dividing the Net Profit by the Average Equity. In fact, that is how Investopedia computes the number. But, in doing so you would not have noticed that Apple's Leverage ratio is 307%. This is clearly boosting the ROE by a large amount. In fact, if you were to back out this number to 100%, the ROE would drop to approximatey 16%. This means that leverage accounts for about 49.4% - 16% = 33.4% of the increase in ROE.
Is this a problem for Apple? It is certainly something to investigate. You would want to compare other companies in Apple's industry to see if the competition has similar leverage.
This also requires having some background knowledge on the industries of these companies. Apple is capital-intensive business. It needs a lot of assets to create the products that its customers love. Therefore, it's likely they need to use leverage to do this. In a nutshell, you need to learn more about why the company is leveraged so much.
If you looked at only the ROE without its principle components, you would not have caught this leverage effect. This is one of the biggest problems with ROE. Analysts will praise companies with high numbers and won't consider the magnitude of those numbers. With the long-form ROE in your arsenal of tools, you can now go deeper with your analysis and uncover information that others fail to consider.
Houston, or Should I Say, Amazon, We Have a Problem!
I bet by now, you are tingling with excitement knowing that a tricky concept such as ROE actually ties out to numbers published by the financial press. However, the Investopedia article has a bit of a problem.

Immediately following the results for Apple, the article compares the ROE for three other stocks, namely Amazon (SYMBOL: AMZN), Microsoft (SYMBOL: MSFT), and Google (SYMBOL: GOOG). The Investopedia article suggests that these companies have the following ROE:
Amazon - 27%
Microsoft - 23%
Google - 12%
Each of these are not correct! How do I know? Because when I did the calculations, I was able to tie out to the ROE numbers reported by Morningstar. Here is a breakdown of what Morningstar reports these numbers to be:
Amazon - 28.28%
Microsoft - 21.37%
Google - 18.62%
For Amazon and Microsoft, you could almost attribute the difference to rounding errors, but not really. However, Google is way off. I am not sure where Investopedia got their numbers from, but using the same formula that they suggested in the article yields the correct results that Morningstar published.
To check Morningstar's ROE for each of these companies, go back to the main page and enter the ticker for the company you're checking. I'll use Amazon since it's next in line:
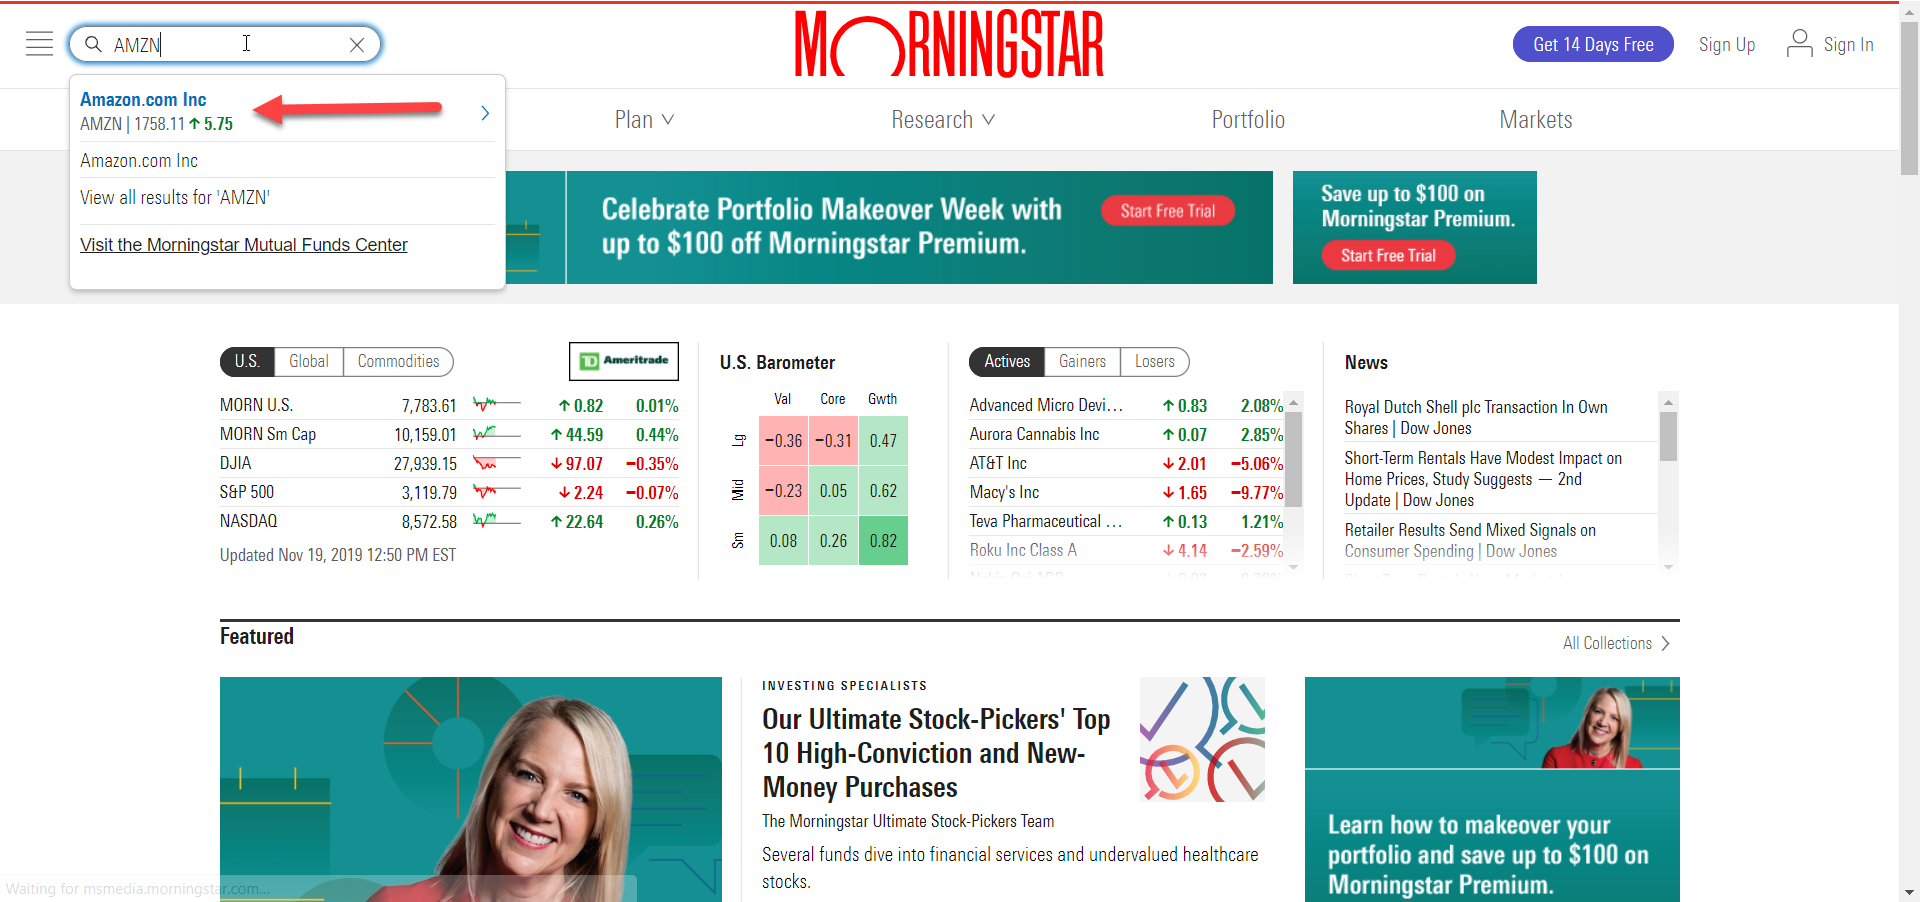
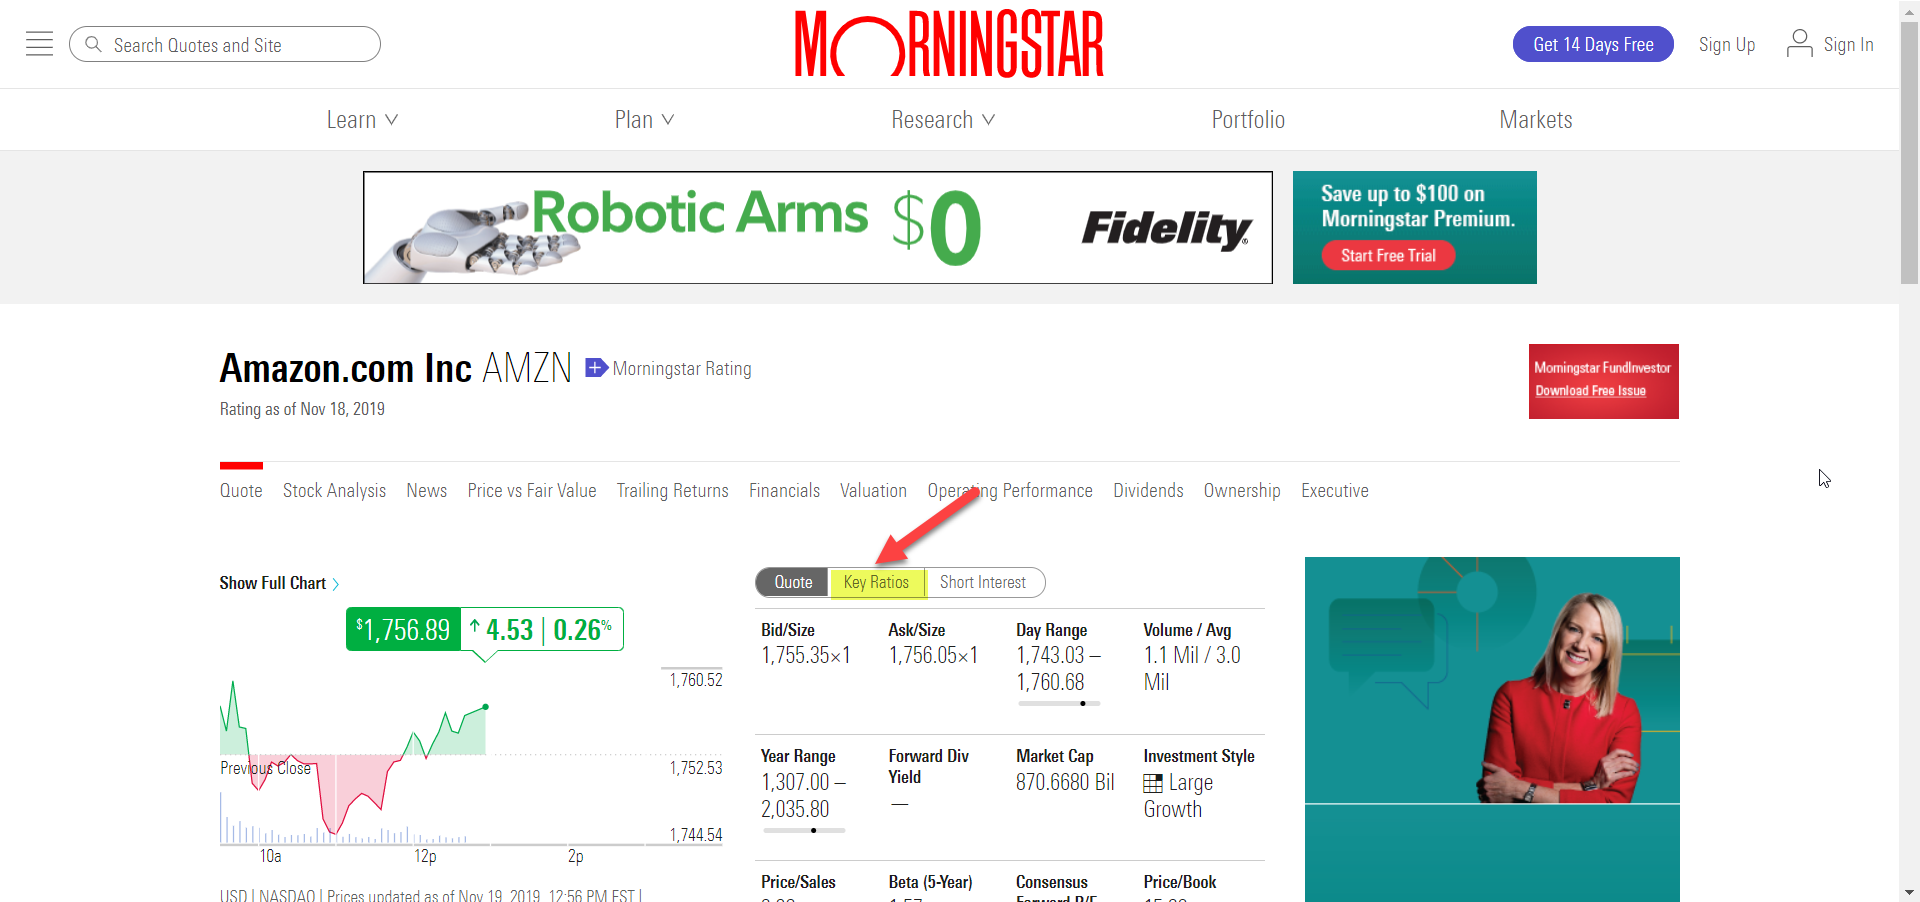
It will bring you to the Quote Screen. From there, select the Key Ratios (as shown):
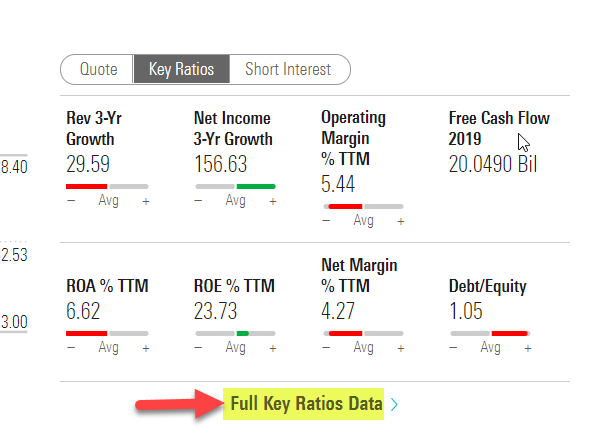
Once you're in the Key Ratios page, click on the Full Key Ratios Data option:
When you see the screen of Full Key Ratios, scroll down to where the Return on Equity Line is:
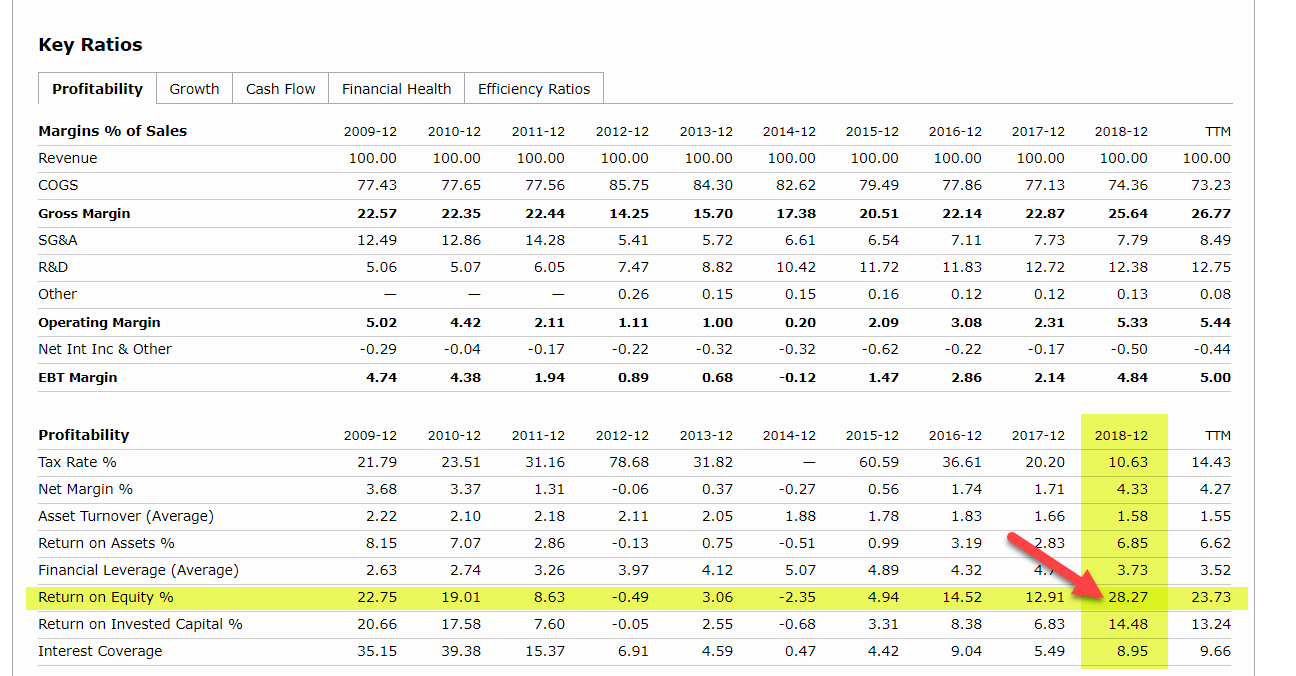
As you can see from the spreadsheet, the calculation is extremely close:

These are the kinds of challenges you'll face when dealing with financial data providers. It is extremely frustrating because they don't always disclose how the numbers are derived. You can find it for some indicators, but many are not disclosed.
In this case, the calculations are correct based on the techniques described in this article. It doesn't matter that an outside entity like Investopedia has wrong information. I was able to tie it out to Morningstar who is the data provider in this instance. I obviously put more weight in the data providers' answers than an article written about how to calculate an indicator.
Overall, I trust the information published in Investopedia in most instances. I am not sure why these numbers are so off, especially since the calculation shown for Apple is exactly what is published in Morningstar and the Investopedia article even shows the exact calculation on how they derived the ROE for Apple. Using the same calculations for the other companies yields the same results as published in Morningstar. It's odd, but you have to move on.
Conclusion
As a suggestion, go through the same exercise as I did for Amazon, for the other two stocks (Microsoft and Google) to confirm that the information provided by Investopedia is incorrect. Use the spreadsheet template that you developed and fill it in with the numbers as shown in the examples above. Then, check the ROE calculated against the Key Ratios page (again as shown above). You'll see that the calculations reconcile with Morningstar. I reconciled all four companies with the Morningstar numbers so this is a good indication that the technique is correct.
Once you have the basis for this calculation, you can use it for your DuPont analysis to uncover companies that seem strong on the surface but may be using debt to artifically pump up this number coveted by Wall Street gurus.

