Your First Taste of Automation
Have you caught the finance bug yet? It's a bug that affects experienced investors or traders. As investors gain experience, they realize they can use the power of computing to do the heavy lifting of analysis. If you're at that point, then this article wil give you your first taste of automation.

Why the Need for Automation?
What Is Meant by Automation?
Is It Necessary?
What We Are Looking to Accomplish in This Tutorial
What You Will Need
Wait! What If I Don't Know How to Code?
How to Download Stock Prices
How to Chart the Downloaded Prices
Why the Need for Automation?
Most investors depend on data to determine their strategies. Even long-term traders will use data to check how their stocks are doing and make adjustments. If they need to make adjustments, it will take time to find new stocks to add to their portfolios.
Going forward, I'll refer to both investors and traders as investors, even though there are significant differences. You'll know which category you place yourself into!
Short-term investors will likely use data more, but having knowledge on how to automate the process could tempt most investors, regardless of trading frequency. Whether or not that is a good development is debatable.
Market data can be used for a variety of purposes. A common one is to download stock prices and use them within trading systems. These systems use the prices to generate signals based on historical signals. They also use the data to generate charts.
Another purpose is to screen stocks based on the criteria of your choosing. For instance, if you want to capture stocks that have low debt-to-equity ratios, you can write an automation program to find those stocks (or hire someone to do it). Since you are creating the program (or having it created) you control what data points to use.
You may be thinking that there are plenty of stock screeners available. Why not just use these online screeners? There is nothing wrong with using these. However, the screeners may not work the way you'd hope they would. If an online screener doesn't allow you to combine several indicators that you want to capture, then it has limited use.
Many screeners now charge people for data. They'll provide a basic level of screening for free, but if you want to level up with more sophisticated screening, you'll have to whip out the credit card. Some screeners will only allow you to download the data from the screens when you pay (e.g., FinViz).
What Is Meant by Automation?
It's important to clarify that the automation described in this article refers to creating code or scripts for a specific purpose. People frequently think of the term automation as processes that run automatically without human intervention.
This is technically true, but this type of automation is too complicated to describe in an article that is beginner-level.
It may be a simple process to schedule an automation procedure that you wrote after learning how to do it from this tutorial. You may think you can create a Windows Task in the Scheduler or a Cron job with an alternative operating system. Then, you feel you're good to go, right?
But what happens when something goes wrong? Did you add logging into your procedure? Where will you store the logging scripts? Will you remember where they are six months down the line when you start experiencing trouble?
Are the errors occurring on your local macine, your network or are there problems with the data providers? Realize that data providers (especially free ones) change their process all the time. It's a frustrating aspect of the automation ecosystem, but one you'll need to deal with often.
Is Automation Necessary?
You'll have investors that swear by their automation and others think it's a total waste of time. Warren Buffer falls into the latter category. He doesn't believe timing the market works, or if it does, you won't do as good as taking a longer-term approach. Over trading costs money and will subject you to capital gains during tax time.
People can rely too much on automation. When taken too far, it defeats the purpose of company ownership. Buying stocks is supposed to be about buying ownership in a business.
Most people don't spend their time buying and selling local businesses like delis or coffee shops. When you make the decision to buy such a business, you're usually in it for the long haul. This is the way stock ownership was meant to work, too. This is how Buffett views it.
Automation is counterintuitive to owning a business for the long haul. If you were running a local deli, it's not likely you'd be glued to a screen watching the stock market all day. Nor would you waste your time creating code or scripts as they wouldn't be useful to you. Your time is better spent running your business.
None of this is meant to encourage or discourage from automation. I write about it because it exists and sooner or later you'll want to know at least something about it. The information in this tutorial is for informational purposes only and should not be taken as me giving advice on investing. Please use the information at your own risk.
What We Are Looking to Accomplish in This Tutorial
This tutorial is not meant to teach you how to code. I have a background in financial programming and can tell you, it takes practice to create such automation programs.
This created a bit of a challenge for me. How do I explain setting up automation for your investing without going into too much detail about how to program computers?
Another challenge is trying to help you learn about the dynamics of automation without having you install a computer programming language on your PC.
You may even have Microsoft Excel installed, and you can use it for automation. But that will require you to learn about programming Excel's language called Visual Basic for Applications (VBA). It's not difficult to learn, but it's more involved than what we're trying to accomplish here.
Taking all of these constraints into account, the choice that I feel is the best to use is a programming language called R. I chose this language because it can get an amazing amount of work done in a few lines of code.
The R language can be run online (which is the approach given in this tutorial), so you won't have to install a programming lanuage on your machine. R can also be installed on your machine if you so choose, but I won't be covering that here.
I'll go over what you need to run R code online in the next section. But now that we have the tool covered, let me explain what we'll do with it.
We're going to download the prices of Microsoft and then display them in a chart. The chart will look like something you see on services like Yahoo Finance and StockCharts.com.
You would think the code to accomplish this would take several lines of code to accomplish this. With many programming languages this would be true. Not in R. How about two lines of code? After you set up the proper libraries, it's two lines of code. The following are the two functions used:
getSymbols()
chartSeries()
Note that these commands are missing the necessary parameters to work. But as you'll see later, it's not much more complicated than what you see above. The two commands are part of the quantmod package in R. Don't worry about what that means. I'll go over it in the next section.
By the way, quantmod is another reason why I chose to use R for this tutorial. It offers a robust solution in the few lines of code shown above.
To recap, we are using the R language online to run two lines of code that will load the stock prices of Microsoft (or any stock for that matter) and then display the prices in a nice looking chart.
Pretty cool, huh?
Tools You Will Need
Most automation requires some type of scripting or programming language. You could create automation in Excel, but most likely you'd need to use at least some amount of Visual Basic for Application (VBA). This is Microsoft's language that it includes in many of its office products.
I already wrote about my motivation for choosing the R language. You have a few choices when it comes to running code in R. You could download and install the free desktop version or you could run the code on the cloud.
The desktop version would require more explanation in this article. I don't want to bog down this tutorial with too much installation instruction as that confuses the process. That's why I chose the cloud version for the tutorial. There is nothing to install. You sign up and start using the online program. Easy-peazy!
This tutorial is not meant to teach about how to program in R. That too, would make the tutorial more confusing. Besides, there are plenty of free resources for anyone wishing to pursue this path.
You'll need the following:
- RStudio Cloud account (free) - using this service allows you to use the code that I provide to download and chart stock prices. You will need to set up an account (see next section).
- Install package quantmod - this could be the trickiest part of the tutorial, but only if you are new to R programming. It's really easy, and I'll take you through the steps. Just follow the instructions word-for-word (copy and paste even) and you'll be good to go.
Setting Up RStudio Cloud
You'll need to sign up to RStudio Cloud to use the online R software. The alternative is to download the desktop version. Signing up for a cloud account is easier. But both versions work similarly.
I feel confident that if you become serious with investing, you'll eventually want to learn basic coding. It will help your efforts. The RStudio Cloud version is a great way to get started.
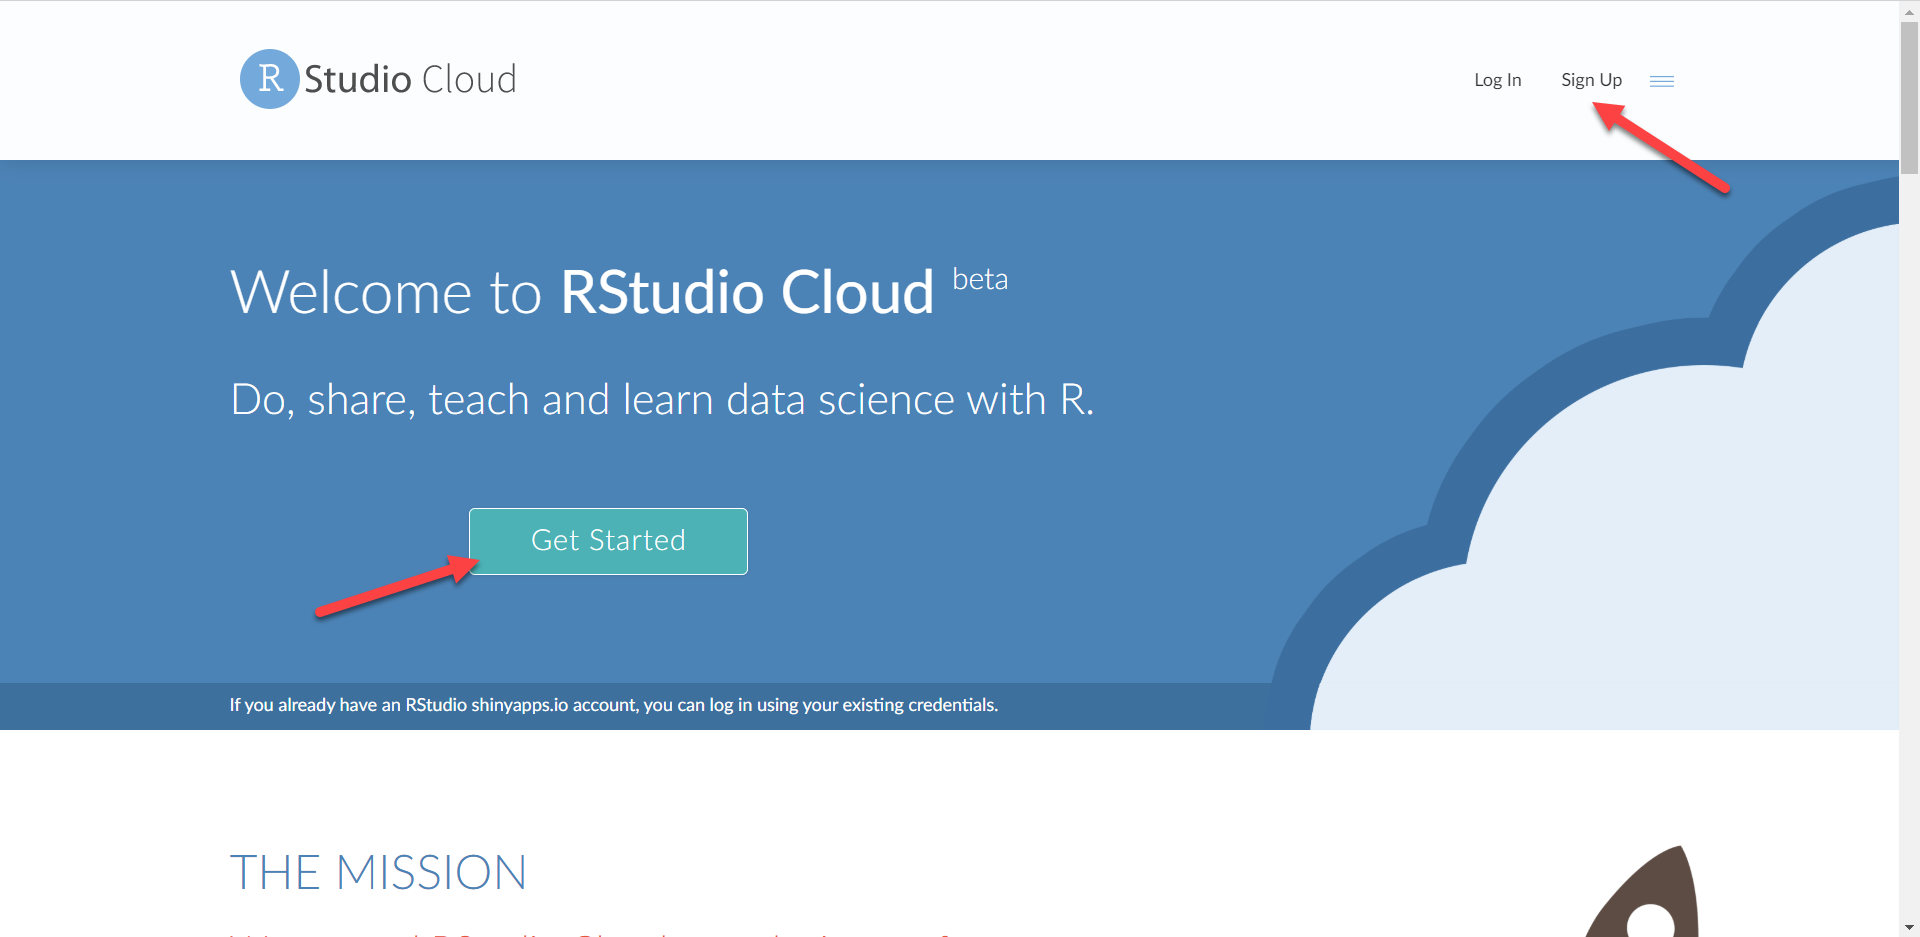
When you navigate to the RStudio Cloud website, you can use the Get Started button or the Sign Up menu option as shown (red arrows):
The sign up page gives you the choice to sign up with an email account or to authenticate using your Google account or with GitHub. If you aren't familiar with GitHub, choose one of the other options:
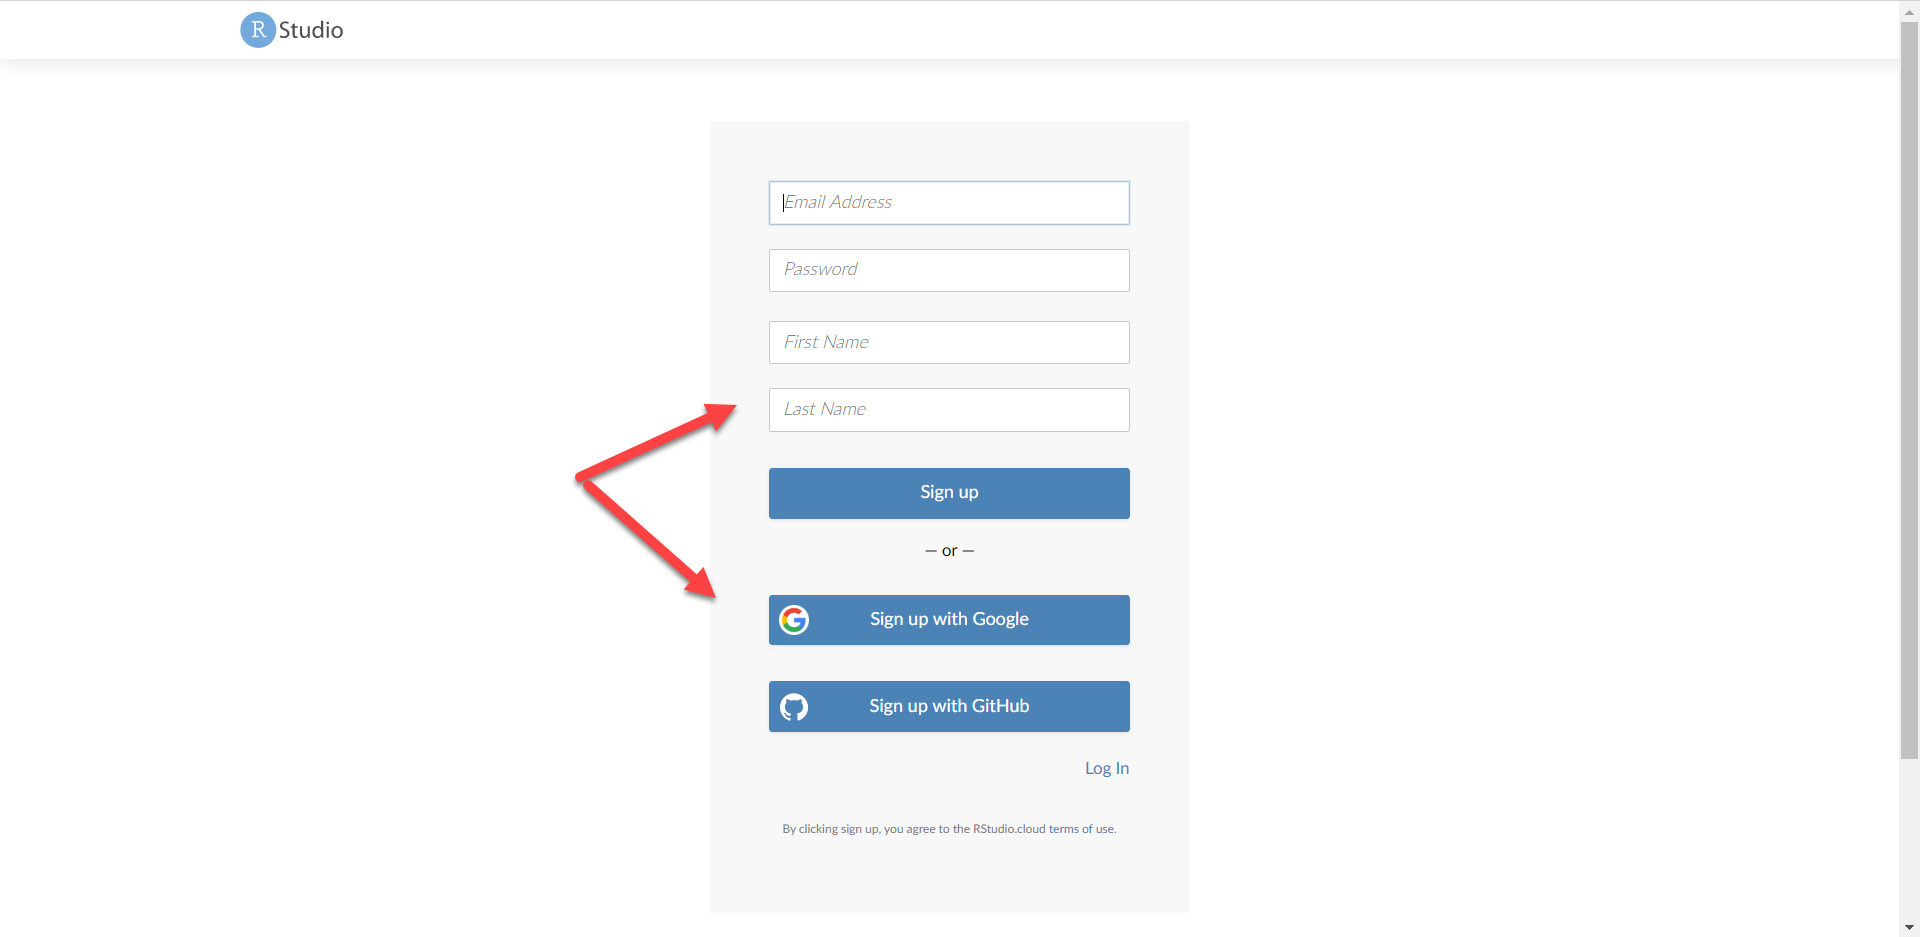
It's a personal choice which option you choose. If you don't like to associate your Google account with third-party processes, choose to sign up via email.
It's been a while since I signed up to RStudio Cloud, so they may ask you to verify your account. Simply follow the instructions, if so.
Once your account is set up, you're ready to go.
Wait! What If You Don't Know How to Code?
My suggestion for those who haven't coded before is to learn. Analzing markets often requires sifting through data. When you have a foundation for obtaining and working with data, it will streamline your analysis.
If you are adamant about not coding, there is good news. You can outsource the coding to someone else. There are plenty of competent coders online. Be aware though, you’ll need to spell out what you want in detail.
Too many people approach outsourcing with a vague idea of what they want. Coders are not mind readers. They will do the best with the information they have. Be as specific as possible. Every tidbit of detail makes a big difference.
Luckily, you won’t have to learn much coding for this tutorial. However, if you want to take what I show you here further, you’ll need to continue spending money on a freelancer (outsourcing option) or learn the coding yourself. There are plenty of resources to help you learn it. It just takes practice, like anything else.
How to Download Stock Prices
Finally, we are ready to download the stock prices. I am going to use Microsoft’s stock prices. But you are welcome to do the exercise with any publicly traded stock. You’ll need to find the stock ticker. You can look it up in Yahoo Finance.
When your RStudio Cloud account is set up, go to your Workspace (if not already there) and click on the New Project button:
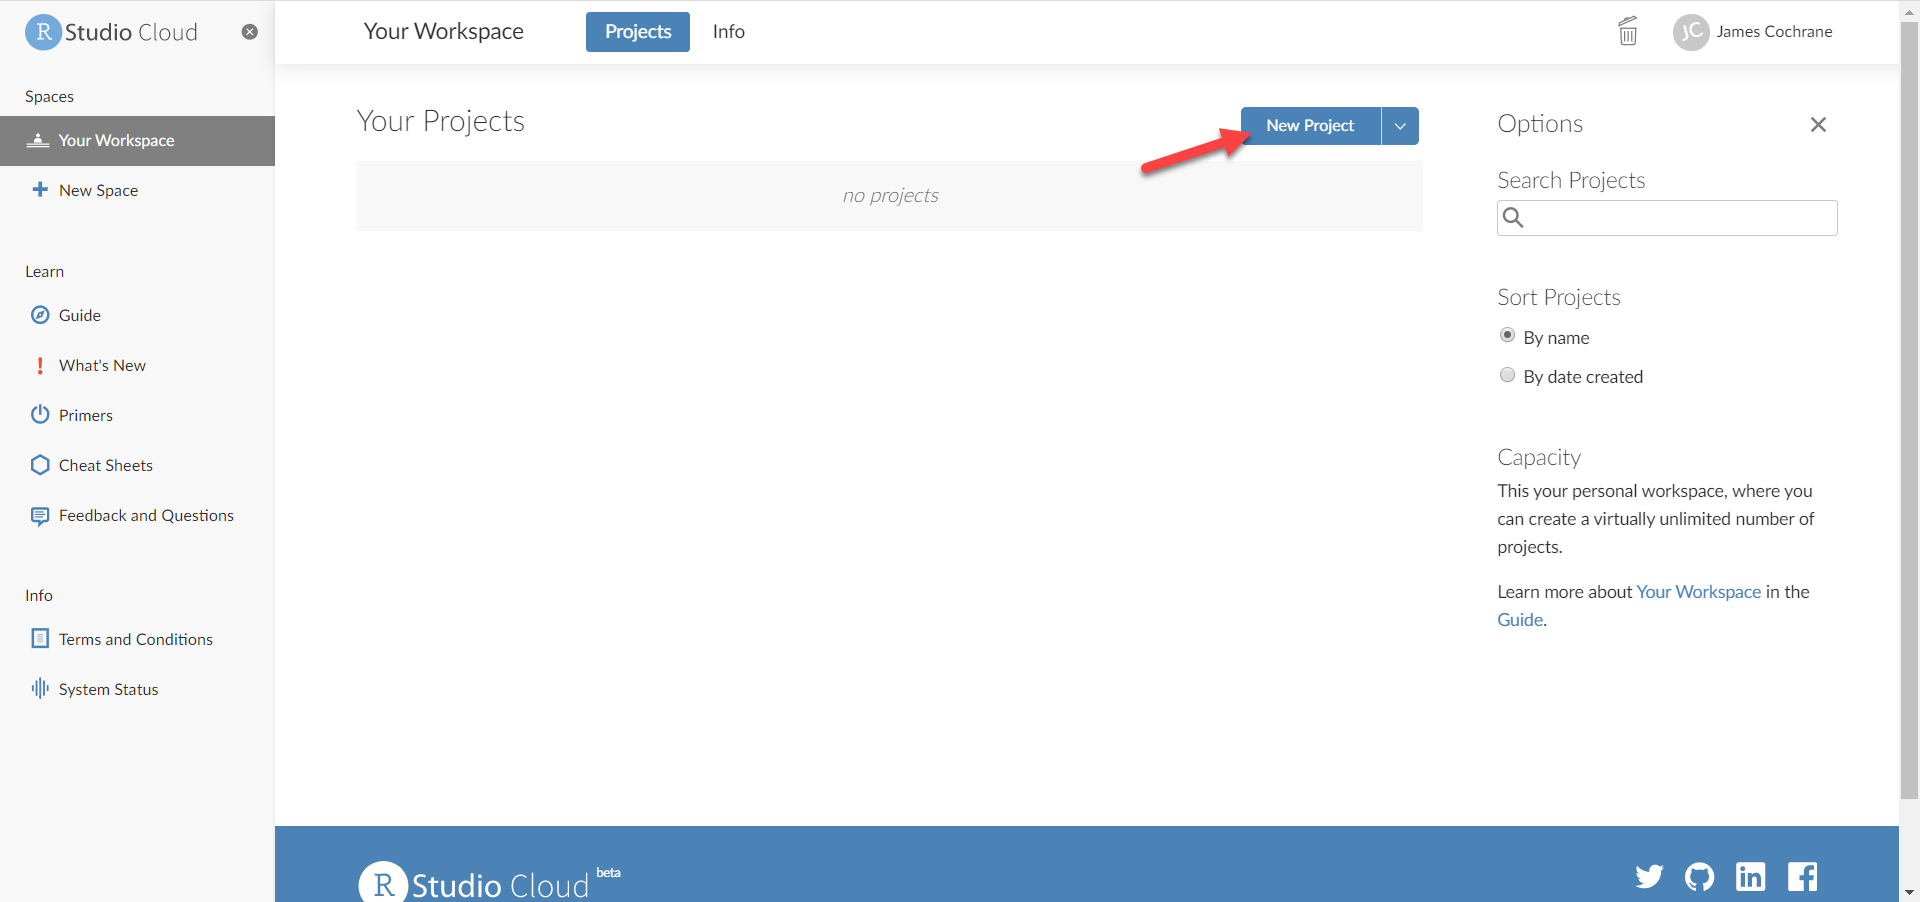
It takes about thirty (30) seconds for the system to create a new projects, so don't worry if it seems like a long time.
Each new project will create a default project name called "Untitled Project". It's usually a good practice to rename it to something meaningful.
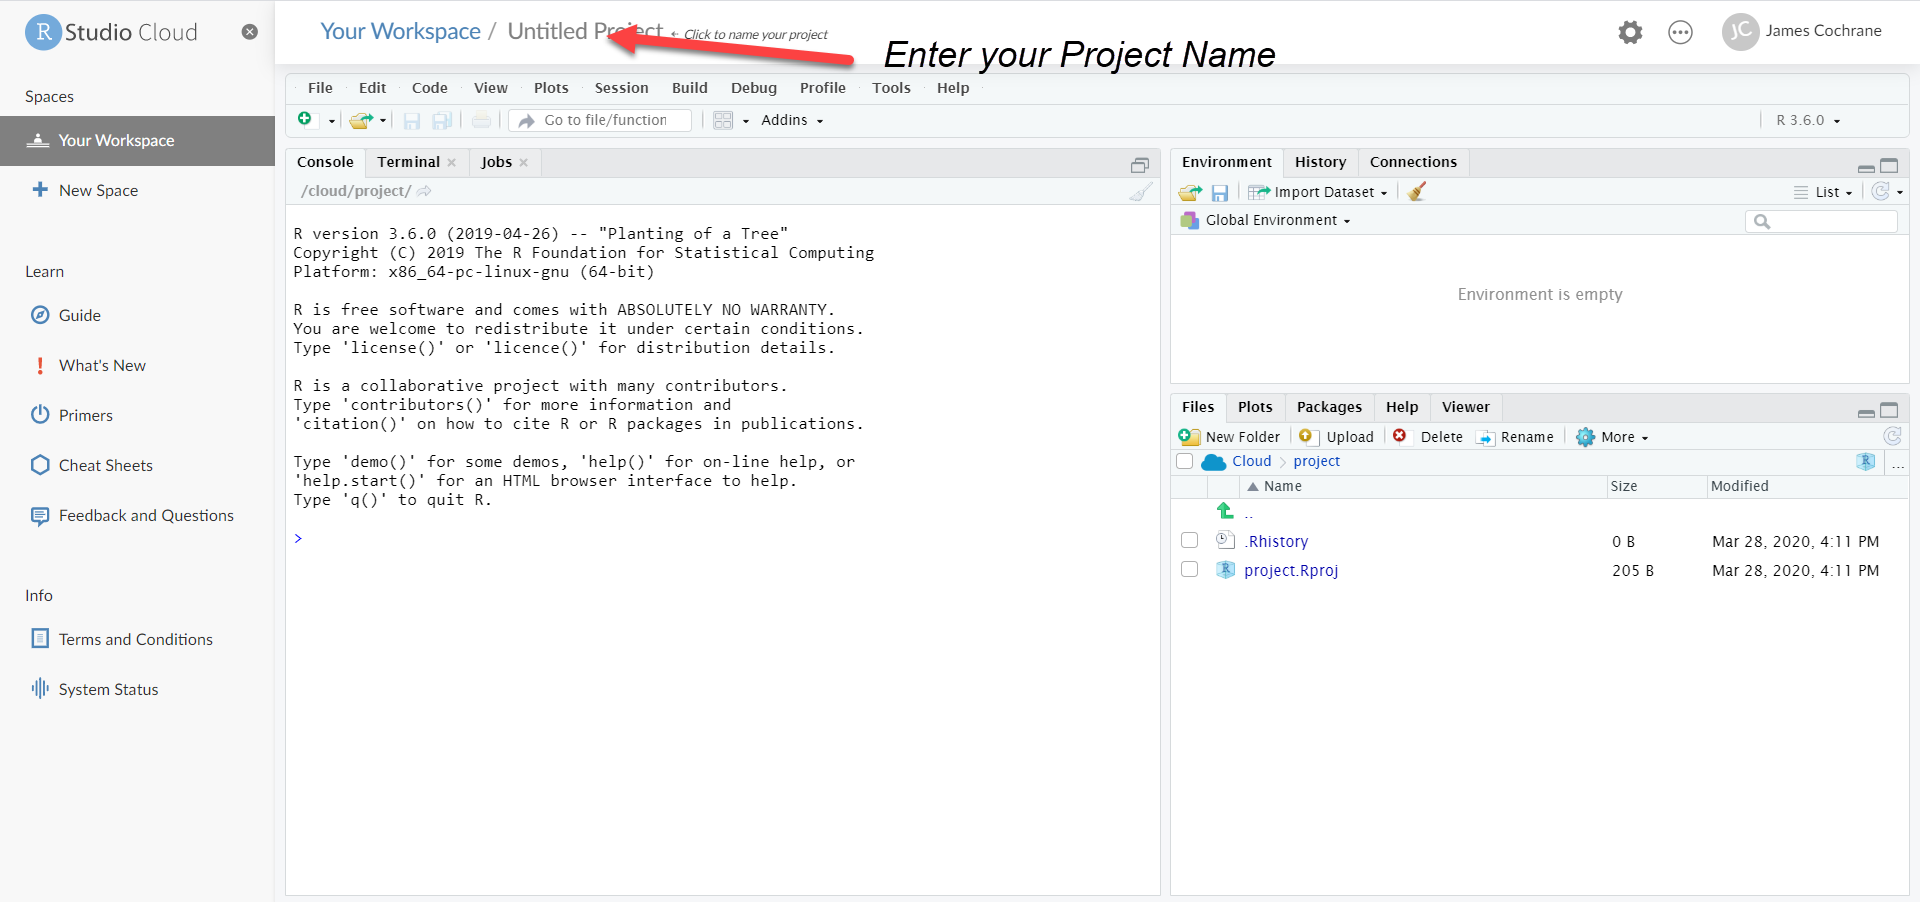
When the creation process is completed, you’ll have a blank project. Change the name of the project. For this tutorial, I’ve called it Quantmod Stock Prices.
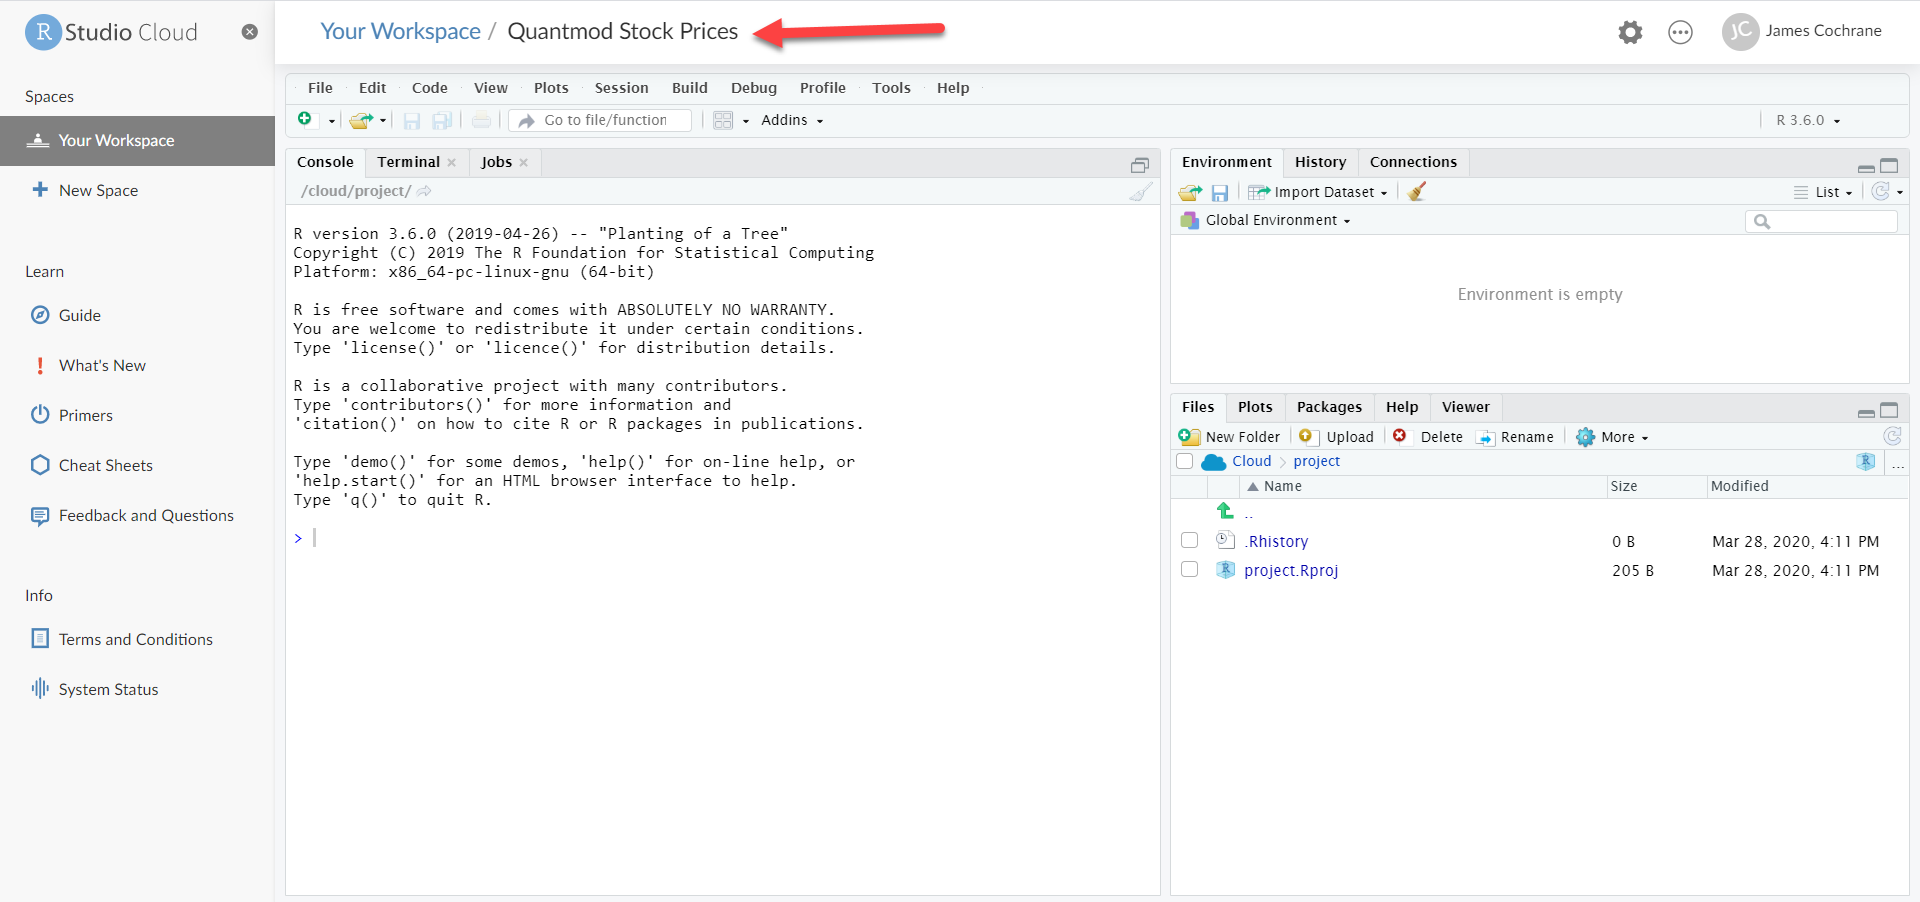
You may call the project whatever you like. It’s a good idea to name your projects appropriately. If you left each of your projects as Untitled Project (default), you’ll have to open each project to see what it is about.
Once the project is named, click on the console (section in red):
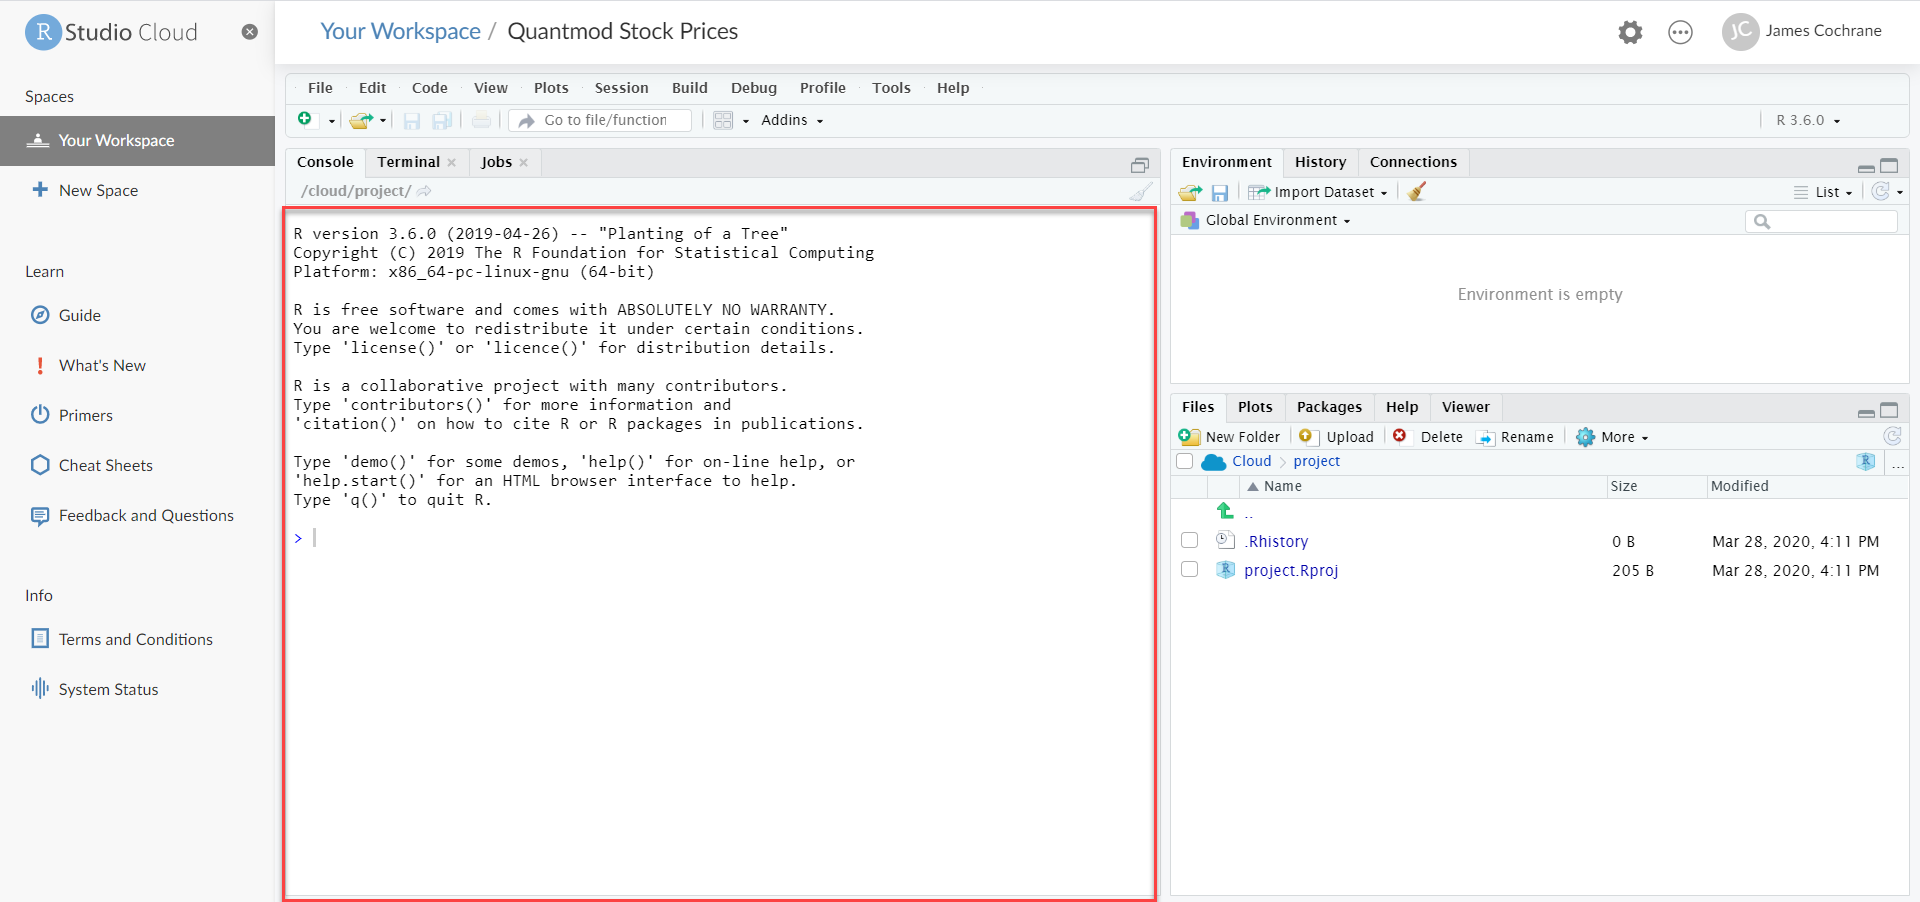
The console is the main work area where you'll run the code that you write. The code is interpreted, meaning that each line will run the code immediately after entry. Conversely, computer languages with compilers would need to be compiled as a complete unit before being run.
Install quantmod Package
R uses packages which are like preinstalled versions of code that serve a specific purpose. These packages get added into the R infrastructure by installing them with the install.packages() command.
The quantmod package is one such package that offers market data functionality. It supports more than just stock prices, too. This is the package that allows us to download and chart stock prices using just two lines of code. It's where the magic happens and it's ease-of-use is why I chose R for this tutorial.
I mentioned before that this step could be the trickiest part of the tutorial. However, it's only tricky if something goes wrong. I have installed it using several instances of R and they all worked without fail. All you need to do is type the following:
install.packages(“quantmod”)
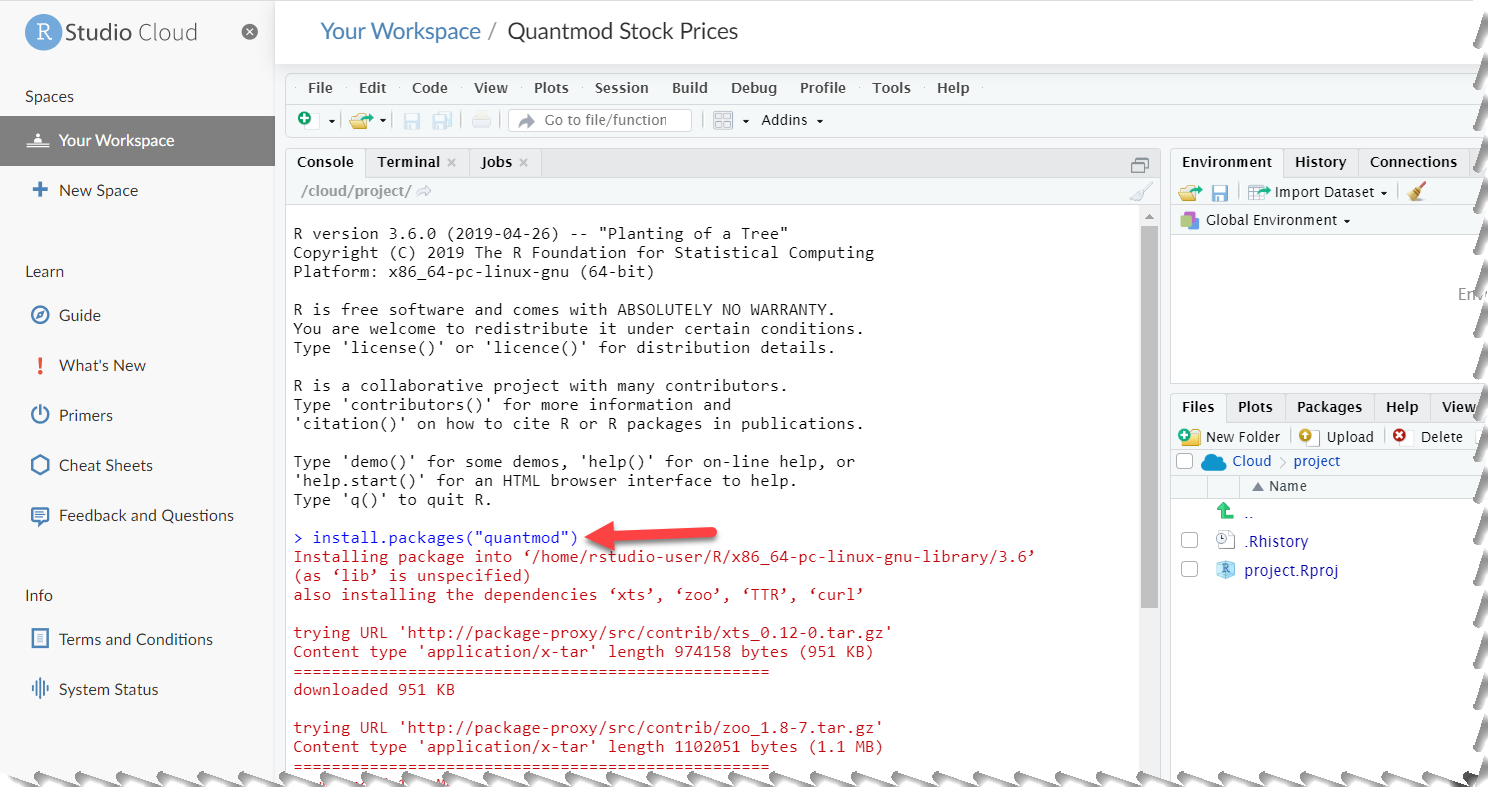
NOTE: R is case-sensitive. Therefore, if you typed in Install.packages("quantmod") instead of the correct install.packages("quantmod") you will get an error. Feel free to copy and paste from above. That way it will be in the correct format.
When you hit <Enter> after the command, you’ll see a bunch of messages in red lettering scrolling down your console screen. This is the normal process for this particular package.
It's an odd choice to display these messages in a red color as red is a convention for display error messages.
The final set messages should show the status that it is
* DONE (quantmod):
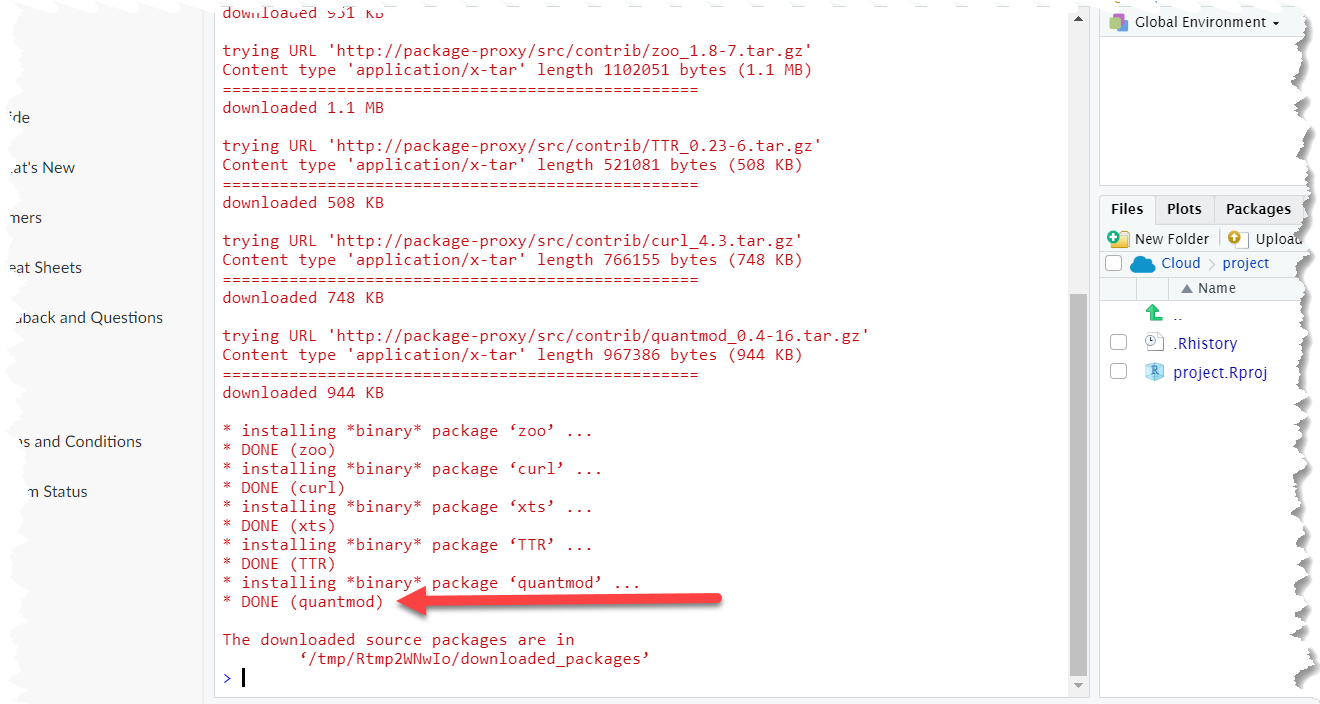
If everything worked, your package is installed. You'll need to tell R that you want to include the package by using the library() command, as follows:
library(quantmod)
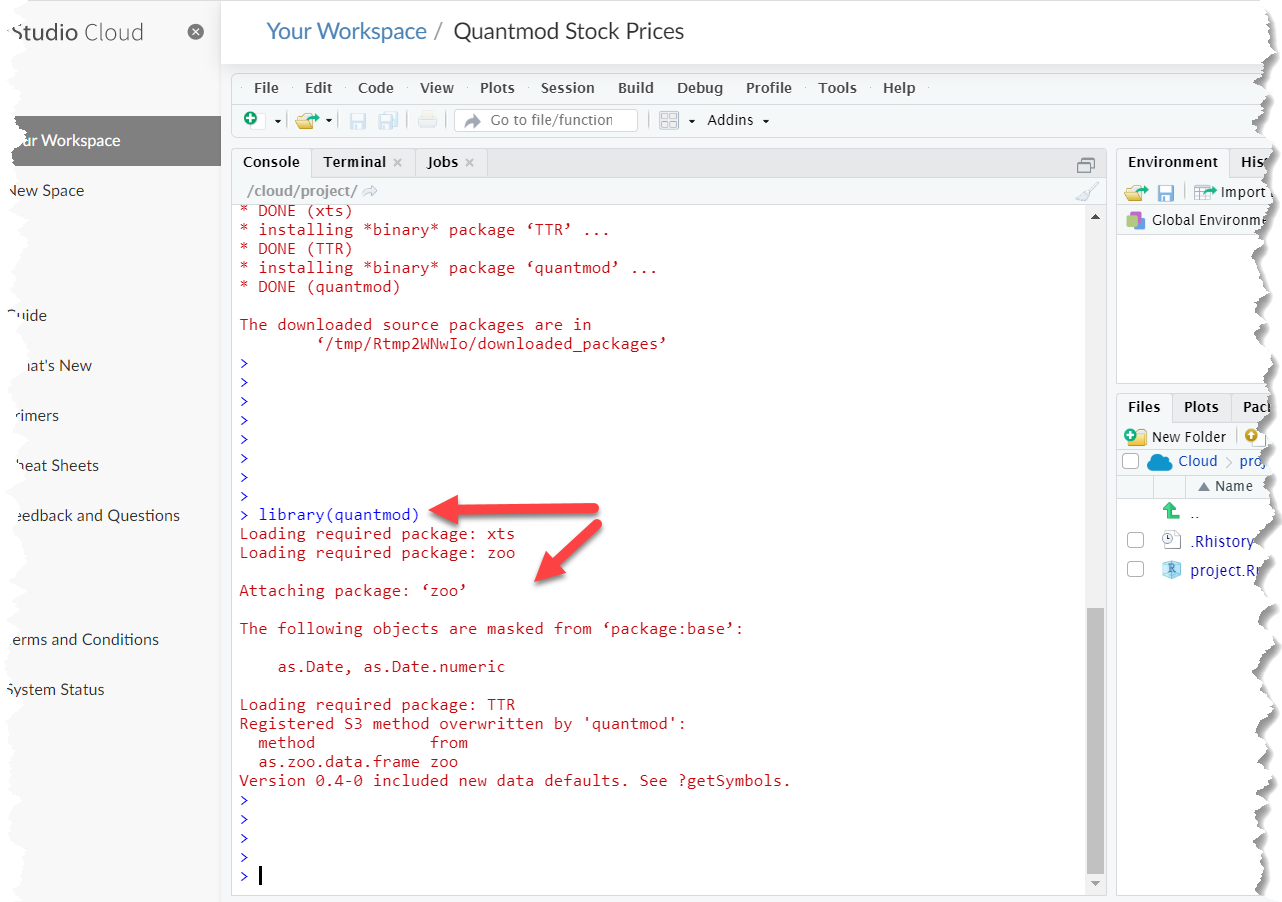
Again, the red messages displayed are a normal function of this package.
If you run into trouble, retrace the steps above. Make sure you spelled the commands correctly. It’s beyond the scope of this tutorial to analyze the possible problems. The best advice I can give is to read carefully the error messages. They can often be cryptic but if you work through them, they usually make sense eventually.
If all else fails, contact the RStudio team for help. It could be something on their end. You could also look for R forums. Some that come to mind are:
r-bloggers.com
stackoverflow.com
NOTE: you won't need to install the quantmod package everytime you load the Quantmod Stock Prices workspace (or whatever you named it). The cloud version of R seems to keep your libraries installed and even loaded. It is good practices to reload (not reinstall) your libaries:
library(quantmod)
It doesn't cause problems to load libraries multiple times. Theoretically, you could run the install.packages() command every time you run the code, but this is largely unnecessary after the first time.
Now we'll get the prices for Microsoft:
getSymbols("MSFT")
Once you run this command, it will create a variable for you automatically. The variable name will be the same as the ticker (but without the quotes)). Type the following:
MSFT
On the console to see the contents of the variable. Note: I am not capturing the screen here for displaying the prices (the results of typing MSFT <Enter> on the console.) I'll leave that for you to see what it would look like. It only serves to clutter the screen which I feel may cause confusion. The whole point of this tutorial is to show you how to capture prices and display a chart using those prices.
How to Chart the Downloaded Prices
The quantmod package includes a chartSeries() function. Simply pass the variable into the chartSeries() function, and you’ll have a chart.
chartSeries(MSFT)
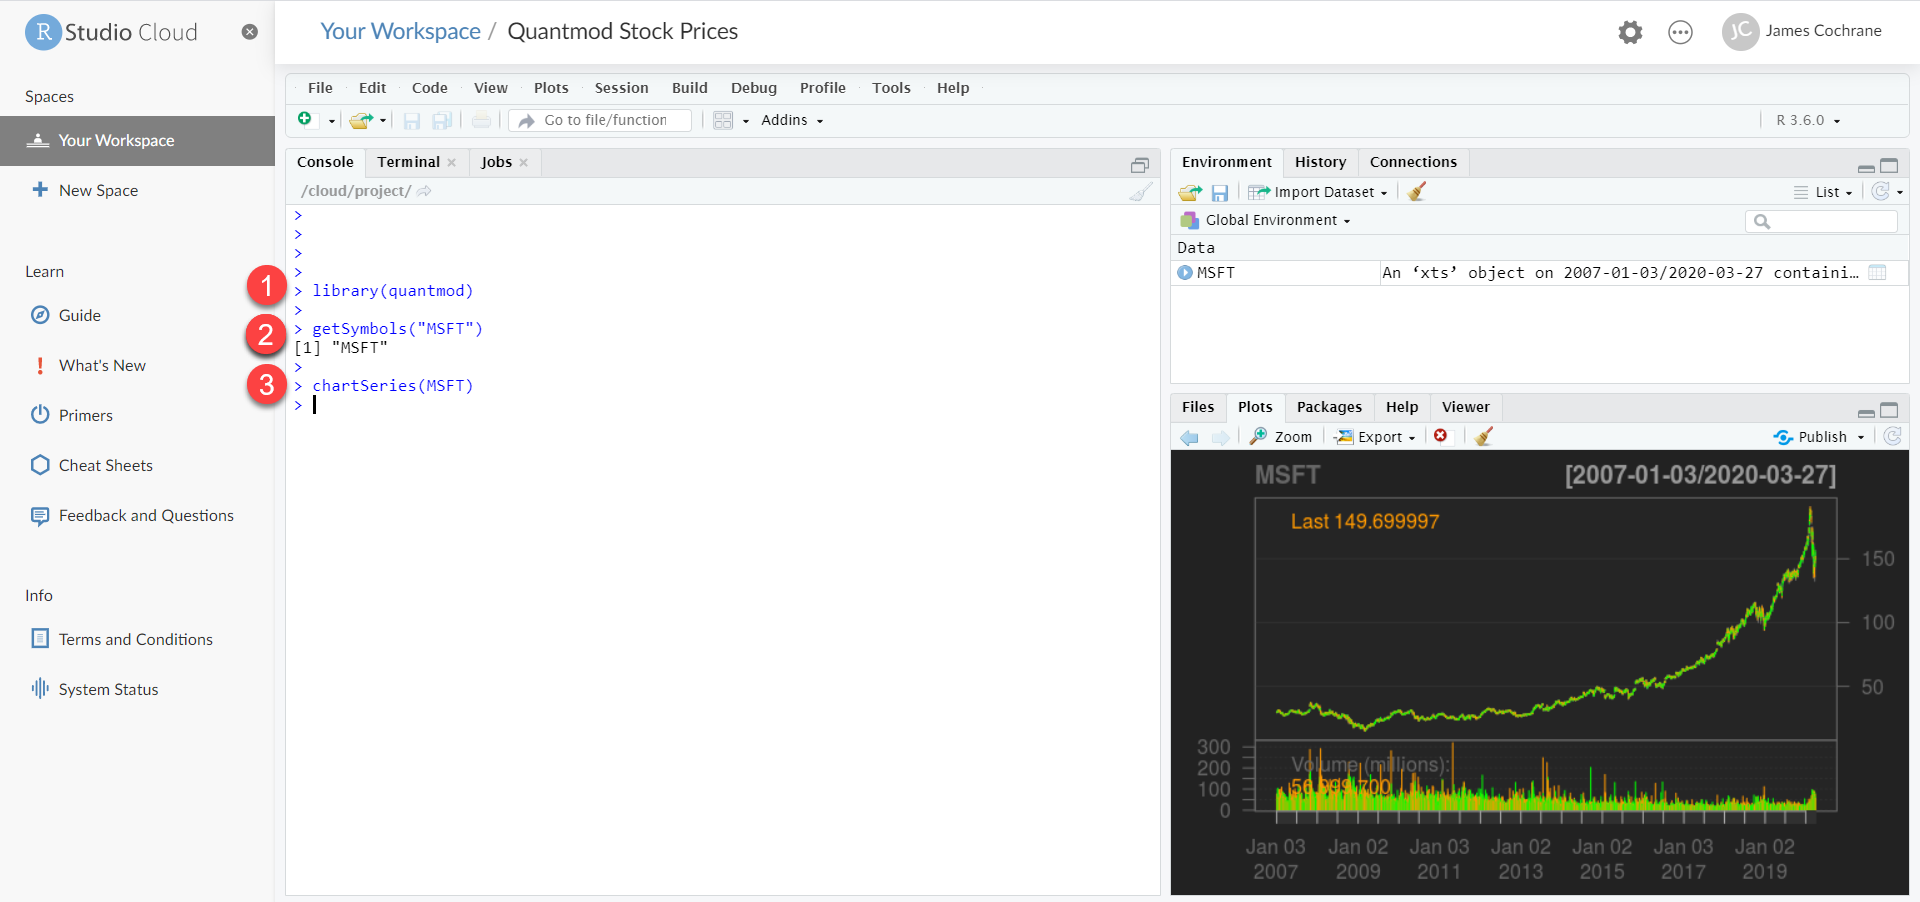
Your console should be similar to the following:
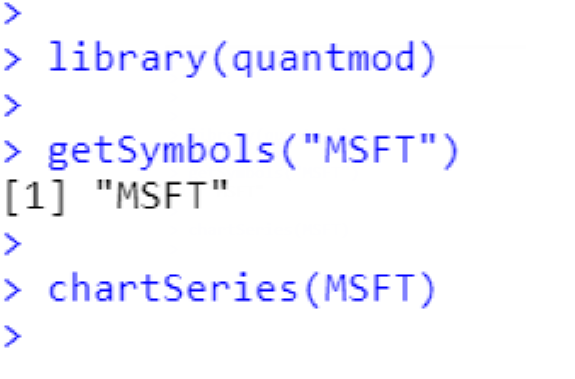
I’ve included a magnified version of the console to see the commands in action:
Is it really that easy to get prices and chart them? Yes! That is why I chose to show you how to do this in R. As I stated, the part that will probably give you trouble would be the installation of the package. But I have installed it several times in different workspaces and have had no trouble.
What About the Automation?
What does creating this code have to do with automation? I have already touched on this topic before. But it is worth revisiting it.
Creating scripts or code is automation. The alternative to running the scripts would require manual work in finding the right data and then using it somehow to help you make investing decisions.
For instance, with our example for this tutorial, without creating the code, you'd have to manually download the files, then format the data for use with some kind of charting package. In our example, we did this with two commands (not counting including the library itself).
Automation can also include scheduling the code units to run unattended. However, the procedures for scheduling the tasks that you write as code units are not trivial. There are too many pieces of the puzzle that require a fair amount of configuration. In some cases, when scheduling these tasks online, you may need permission which may or may not be granted.
If you decide to pursue some kind of scheduling functionality, you'll still need units of code to schedule. I showed you the prelimary methods for accomplishing this.
One area that I did not show you is how to set up a script in R. If you don't use a script, you would need to enter in each command one at a time on the console. RStudio Cloud keeps your last session active, but the desktop version of RStudio does not. If you were to transfer the operation of your automation to the desktop version, you would need to reenter each line of code.
Creating a script file with the code takes care of this problem. It will also be needed if you decide to find a scheduling algorithm.
Here are the general steps on setting up a a script for the work we did in this tutorial.
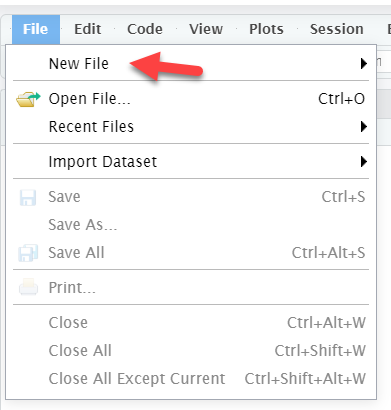
1. Move the code from the console to a script file. To do this start with selecting the File menu option.
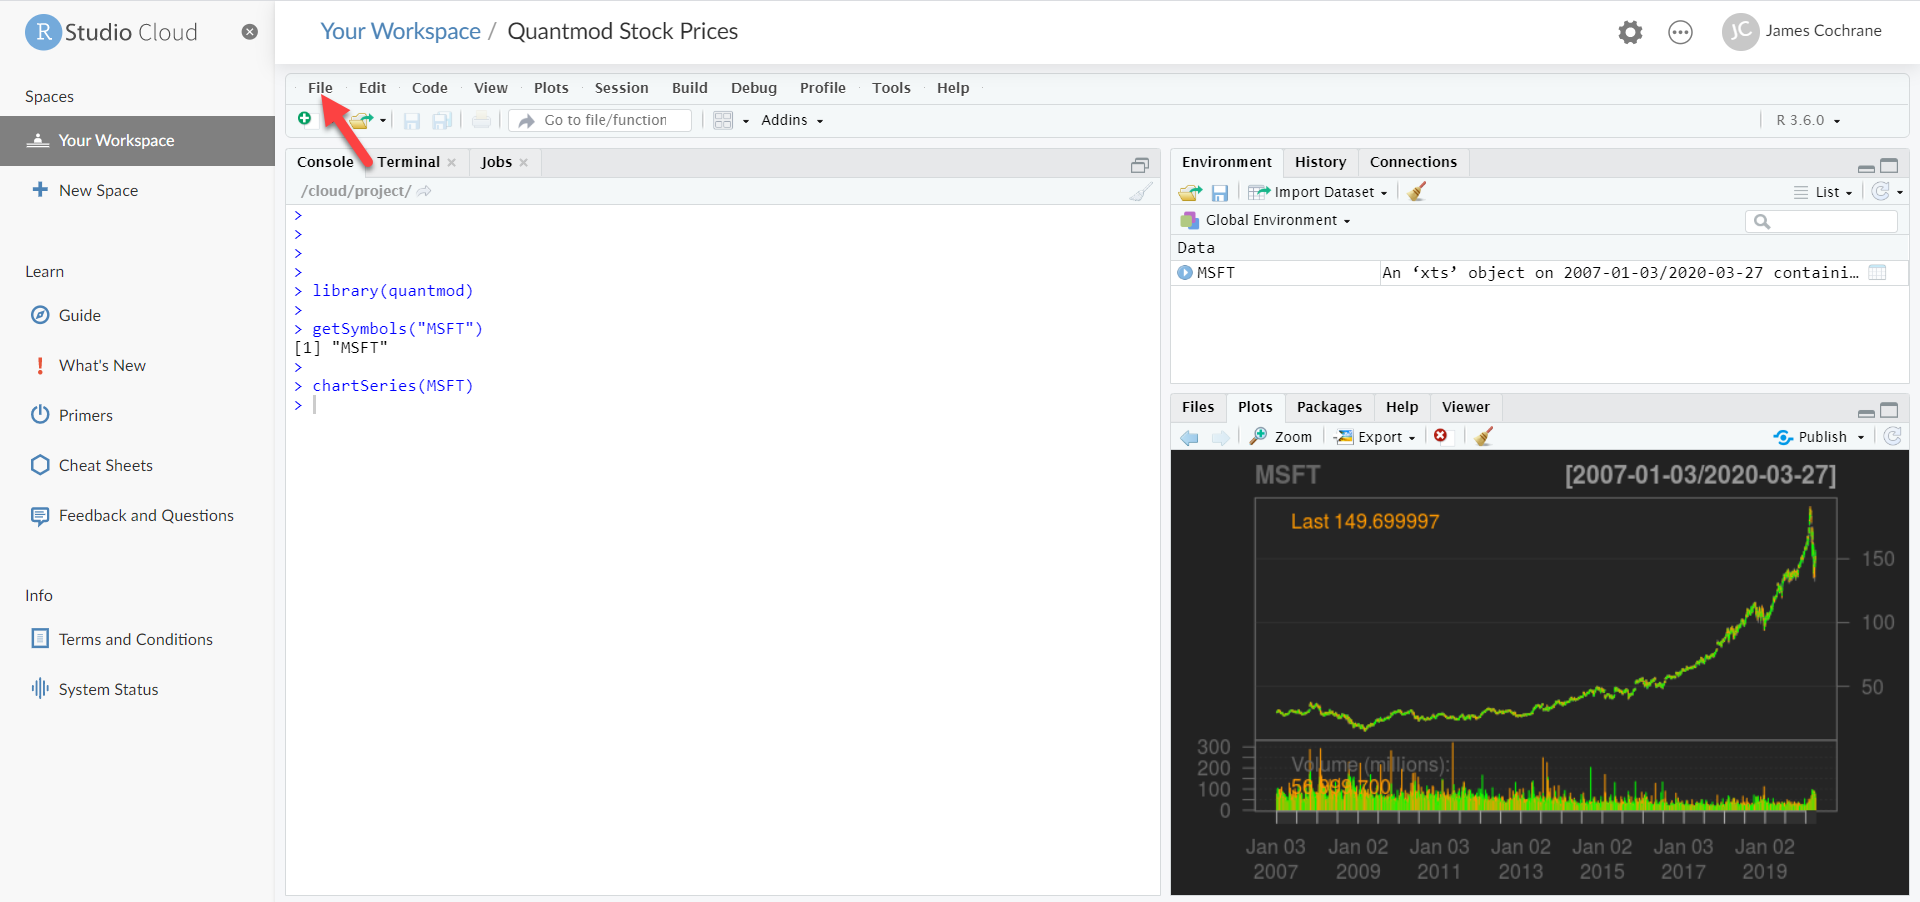
Then select New File...
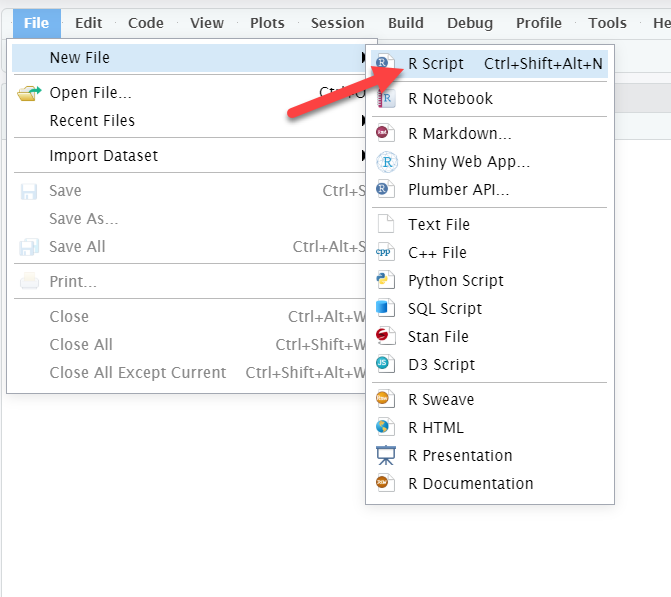
Click on R Script option when it appears:
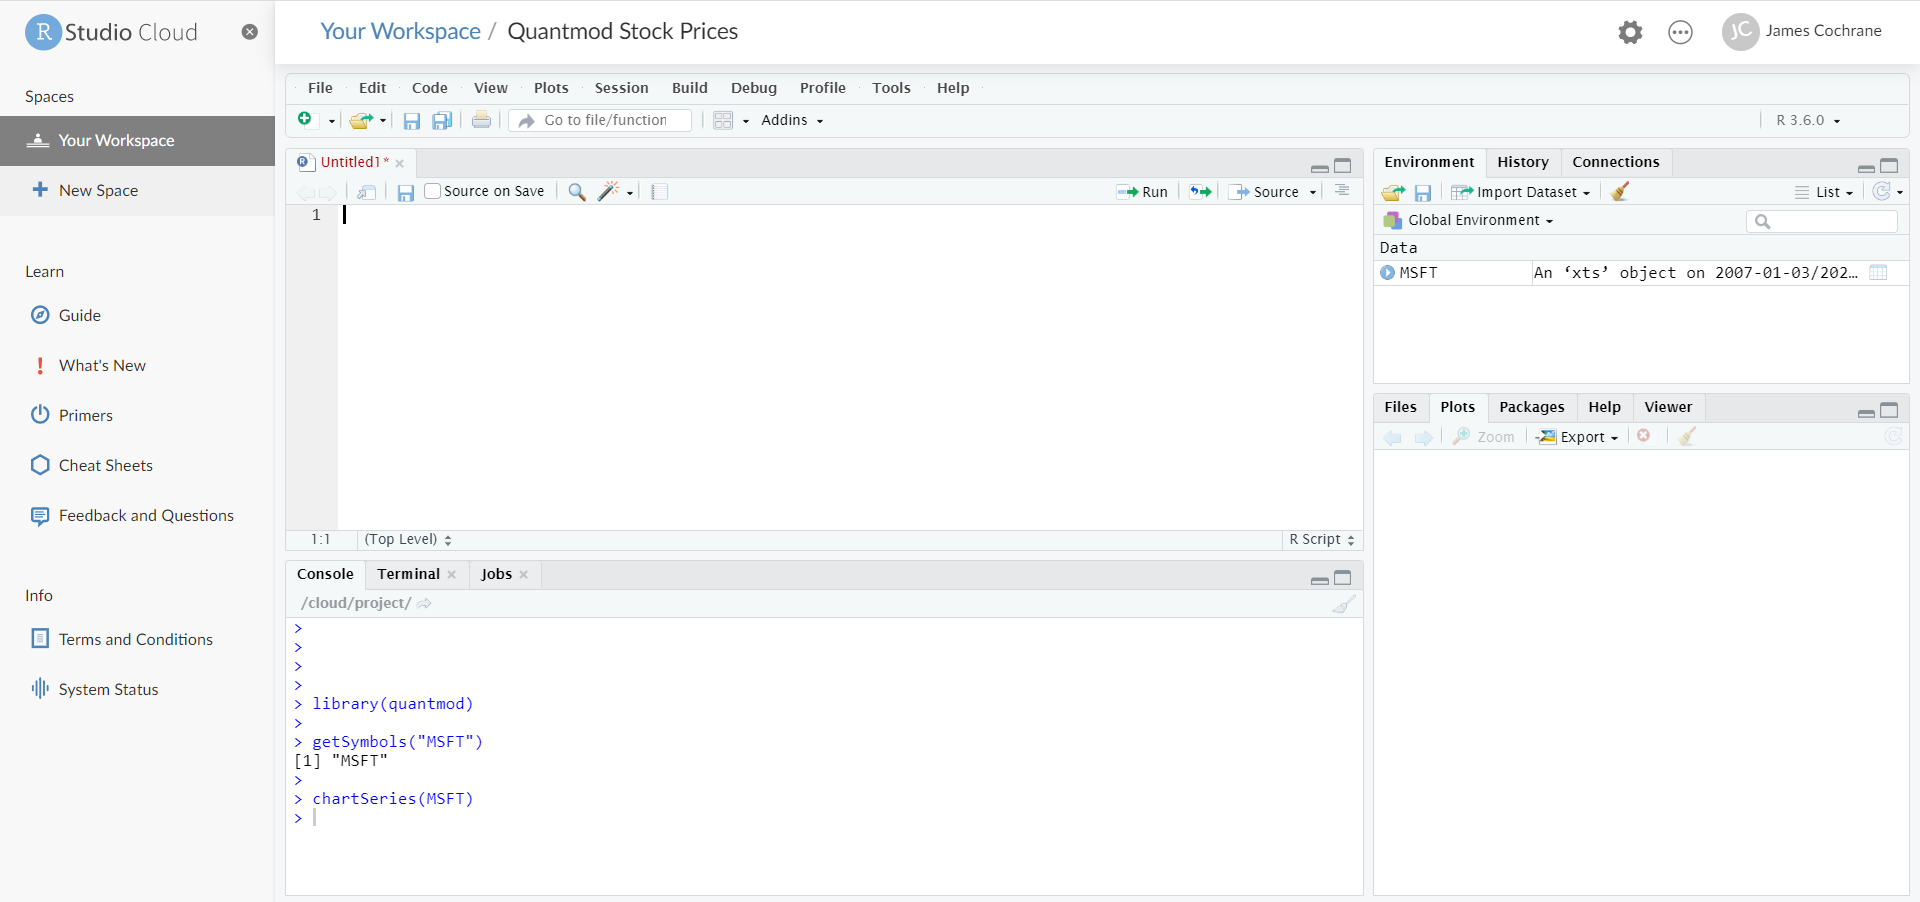
A new window will appear above the Console:
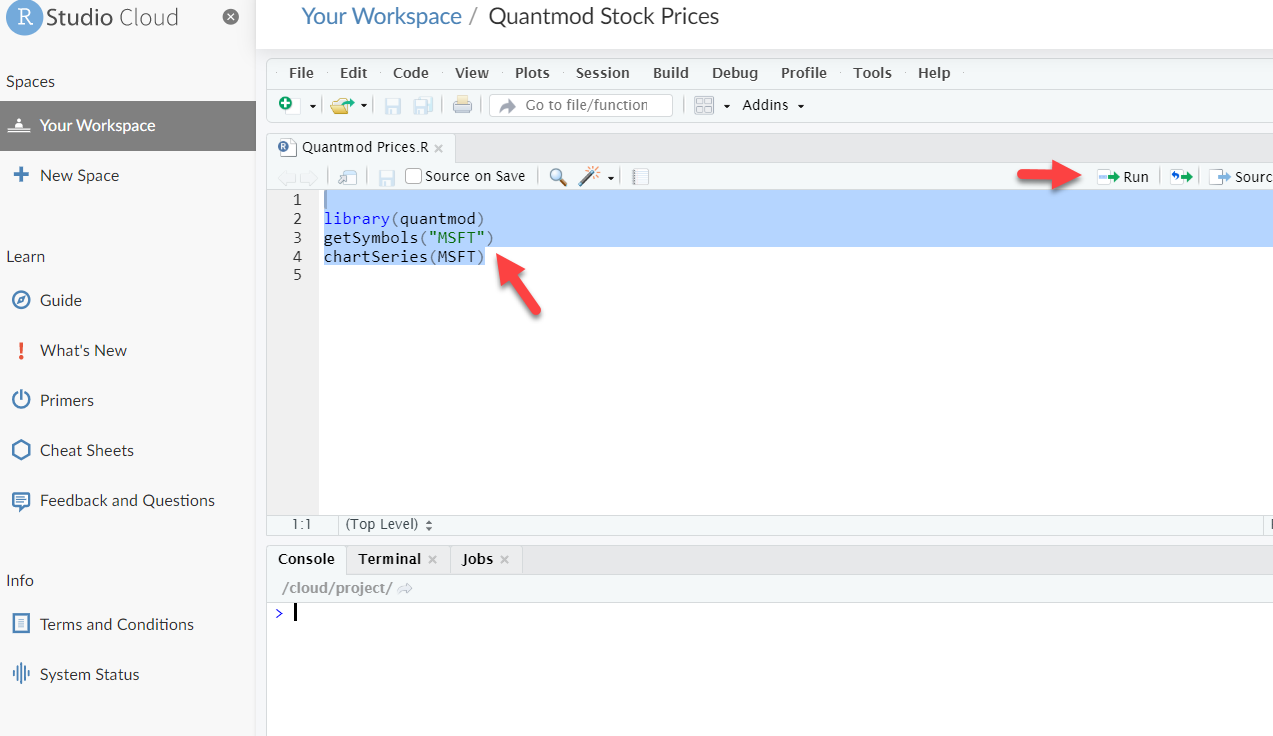
Type the code in this new script window:
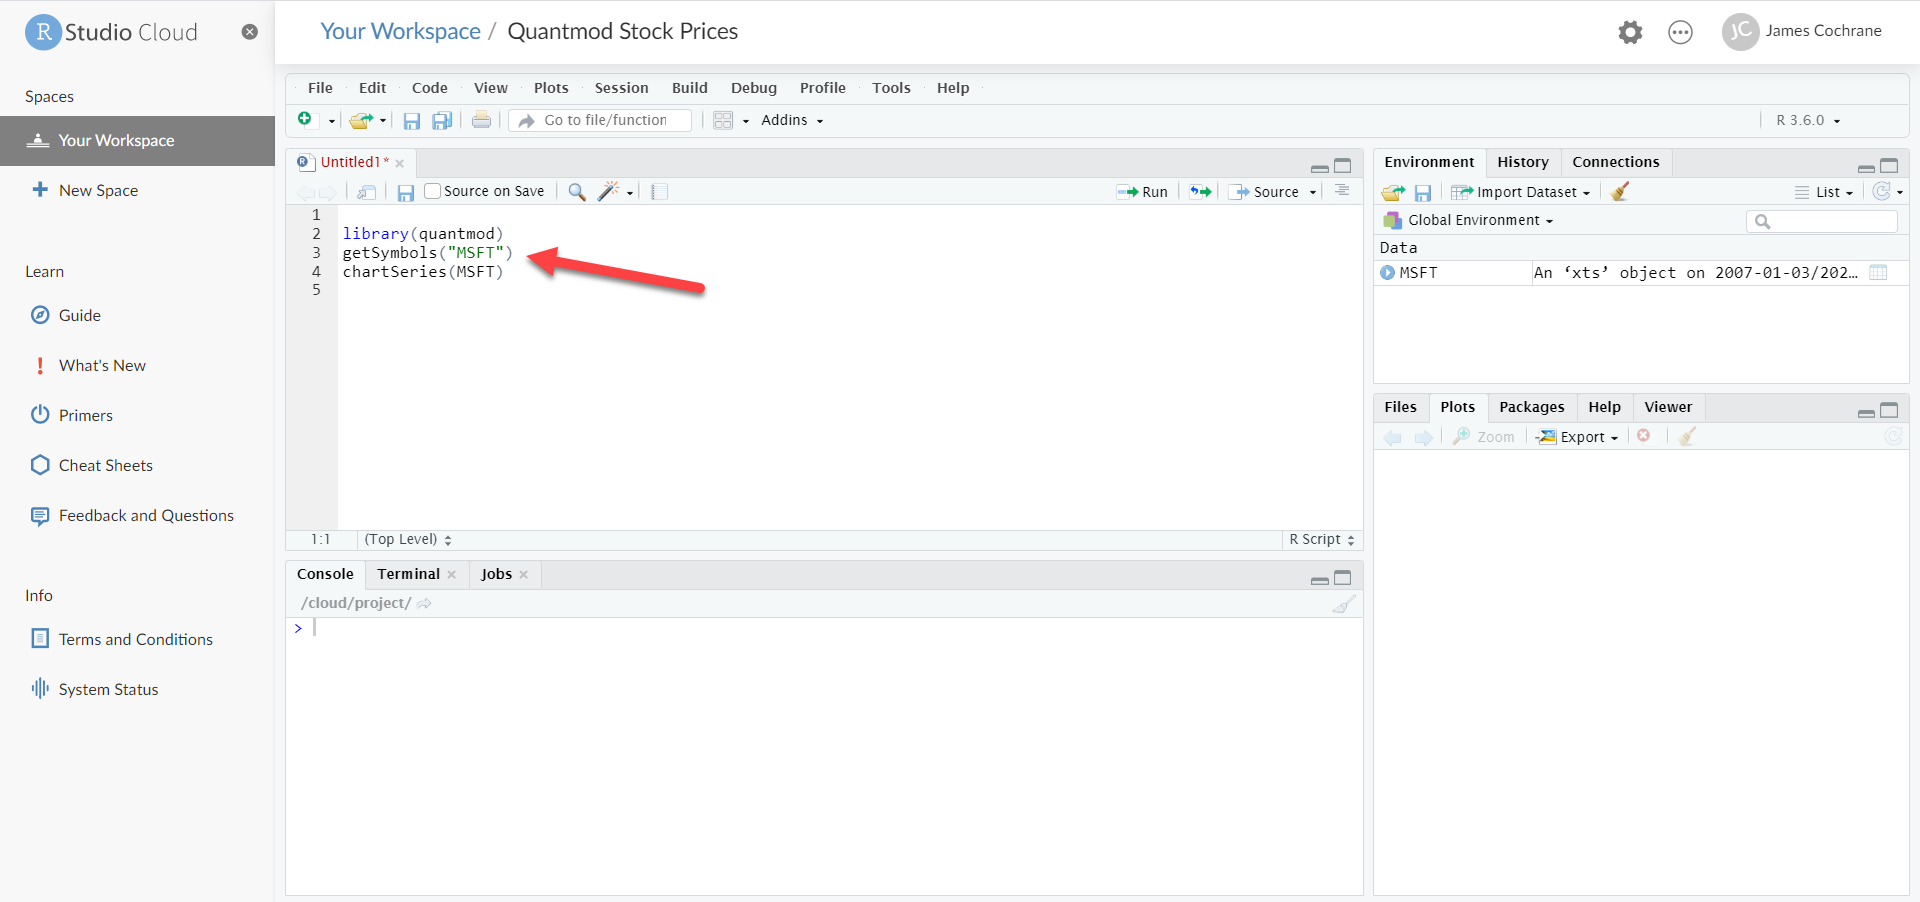
Select File->Save and save the file.
When you want to run the script, highlight the code and hit the <Run> button:
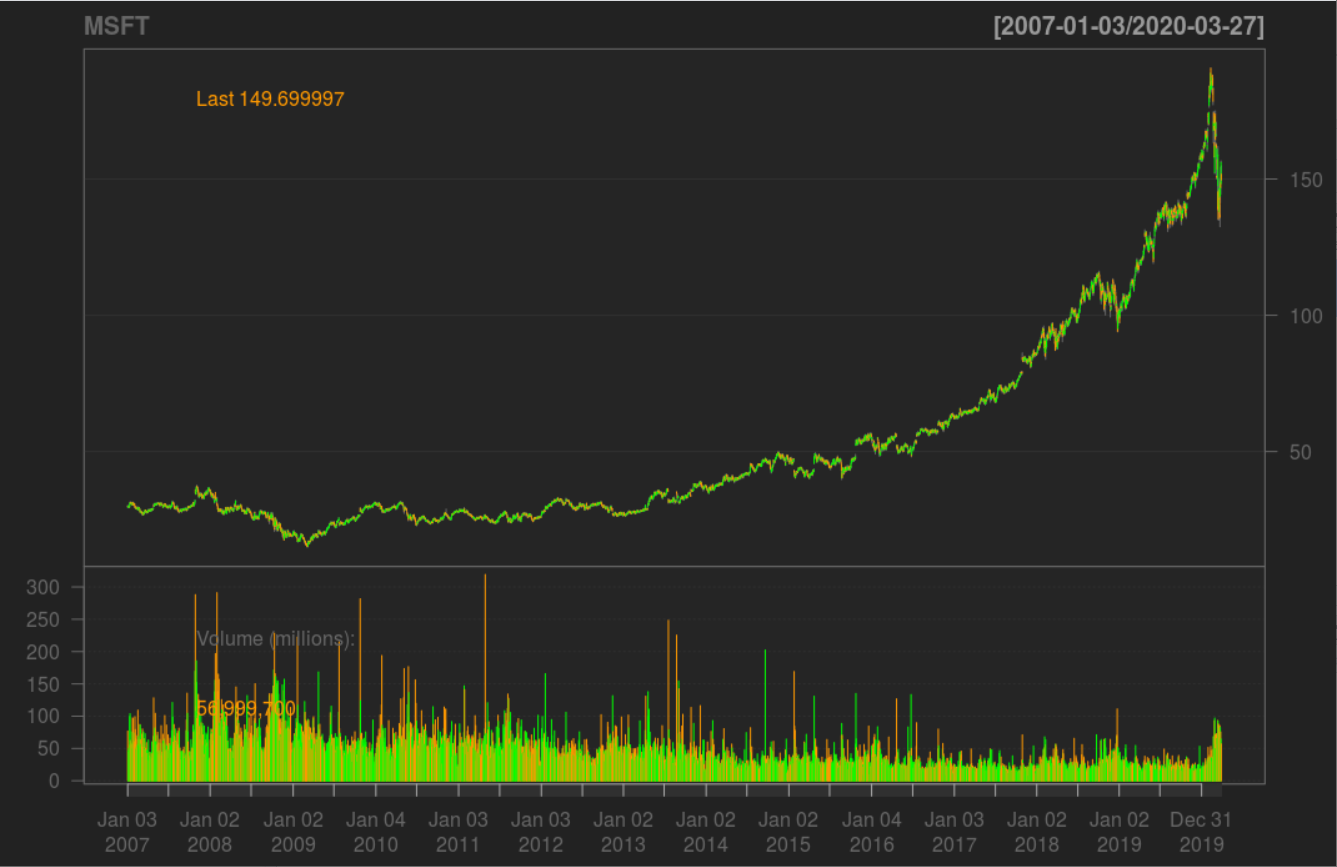
The results should be exactly as it was before, with a chart created for Microsoft in the chart section of RStudio. Note: your chart may look different than the one created previously. Prices change on a daily basis.
Where to Go From Here
As you learn more about coding, you’ll likely make your tasks more sophisticated. For instance, there are many options in the chartSeries() that let you customize your charts. You can add indicators or you can change the look-and-feel. You can also set up email to send when a signal is triggered.
It wouldn't be a terrible idea to learn how to code in R. The following resources can help you get started. I've chosen resources that are free (at the time of this writing).
R Basics - R Programming Language Introduction - with this free class, you'll learn the basics of R and RStudio. It's not meant to make you an expert on the language, but it gives you a solid start.
R Bootcamp - Jared Knowles - I was skeptical when I first saw this because the tutorials are nothing but slideshows. However, upon further inspection these slideshows are well done by the author. It is certainly worth a look.
Introduction to R for Data Science - I took an R class on edX.org. It was a good class to learn R programming. Most courses on this platform can be audited for free. When you audit the class, you'll be restricted. However, you still get enough material to learn what you need.
Don't be afraid to experiment. For instance, with the quantmod package, there are many features that you can use to change the look-and-feel of the charts or to streamline the process for getting quotes.
The possibilities are endless. Of course, R is not the only language to create automation. It may not even be the best. But for the purposes of showing you how to set something up quickly, it does a great job.

