How to Create Your Own Custom Stock Screener
At some point as an investor, you’ll want to start scanning for companies based on specific criteria. The first step is to seek out services on the web that offer this filtering. You may find a few that you like, but they usually are restrictive and contain advertising.
Many of these services have custom options but usually incur a monthly cost. This article will help you learn how to create your own custom stock screener to get around this.

Disclaimer: Website owner may receive commissions from purchases made through links on this page.
Why Use Stock Screeners?
You may wonder if using a stock screening programming is necessary. The truth is it will save you a tremendous amount of time. When you learn the properties that constitute a quality company, you don’t want to spend hours searching through financial statements to strike out with most of your finds.
Analyzing financial statements is important. But it’s better to start with filtered selections. This narrows your research significantly. For instance, if you won’t even consider companies that take on too much debt (however you define that), you can set up a screener to weed out companies that match your parameters.
This article is comprehensive and shows how to create a custom screener for stocks. If you don’t need this functionality but want access to financial data for a wickedly low price, check out this offer to get in on it today. The price is going up soon, though!
Why Not Simply Use the Free Stock Screeners Online?
You are within your right, of course, to ignore the advice in this article and use free stock screeners online to your heart’s content. For many people, these are good enough to get the job done. But for those who want a bit more control over the process, creating a screener is a worthwhile endeavor.
Tools to Create a Custom Stock Screener
I know you may be thinking that stock screeners are software programs, and you don’t consider yourself a computer programmer. Fair enough. However, the key is to keep things simple. Use tools that don’t require coding (not much, anyway) and can be learned quickly. Otherwise, you’ll be better off sticking with the online free screeners.
The tool that I am going to recommend for the task is Google Sheets. Further in this tutorial, I’ll also recommend another tool that you can use to enhance your screener.
Why Google Sheets?
I could have recommended Microsoft Excel. However, not everyone has a licensed copy of the software. Therefore, it wouldn’t fall under the category of a free solution. Google Sheets is available to anyone who has a Google account, and it’s free of charge.
If you know how to use Excel, you essentially have the knowledge you need to use Google Sheets. Not every command will be the same, but you’ll be able to quickly grasp the differences.
Using Google Sheets for a Simple Stock Screener
For this part of the tutorial, we’ll keep it simple. We’ll confine our search to a few metrics that you can easily find using native Google Sheets functions. While I mentioned previously that you don’t need to be a computer programmer, you should understand how to work with Google Sheets (or even Excel) functions.
NOTE: Although this article touches on the basics of using =GOOGLEFINANCE(), there is a more in-depth tutorial that I wrote several months ago. It shows you where to look for help. Check out that article if you are not familiar with how this function works.
Scenario 1 – Price Action Trigger
In this scenario, we will set up a Google Sheet to change a Trigger field from “No” to “Yes” based on a threshold value, as shown:
Step 1 – Start with a new Google Sheet instance.
You’ll need to be signed in to your Google account to make this tutorial work. You can sign in (or sign up) in the upper right-hand corner of the main Google search screen as shown here:
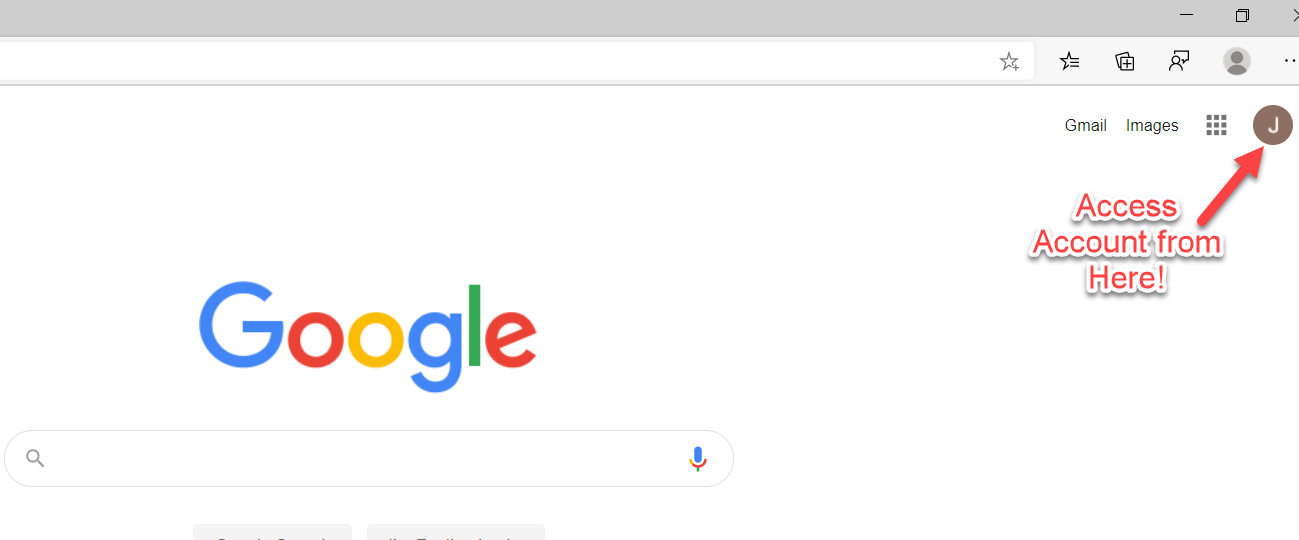
As you can see, my screen print shows I am already logged in. If you don’t have an account, you use this option to sign up. Simply follow the instructions given (it’s wizard-based).
Step 2 – Create a new sheet
Use the following URLs (both should work):
https://docs.google.com/spreadsheets
The first URL redirects to the second.
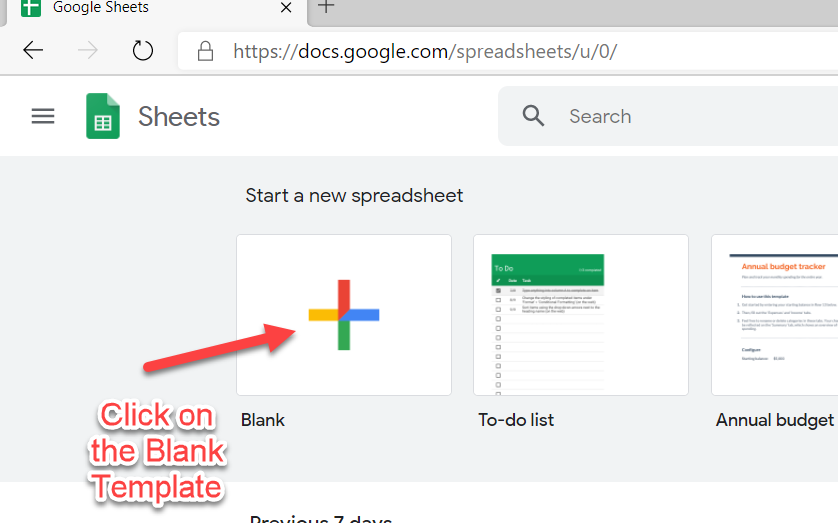
Step 3 – set up the sheet as follows:
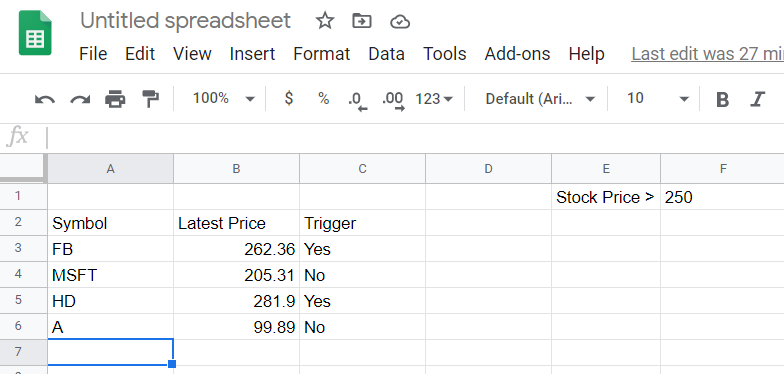
Column A – contains the stock symbol
Column B – contains the formula =GOOGLEFINANCE() to get the latest stock price
Column C – specifies the trigger on whether the stock price meets the criteria in the threshold (cell F1).
Each line will use the =GOOGLEFINANCE() call to obtain the latest stock price. Then, the Trigger will be set up as an =IF() statement to check the price against the threshold (cell F1).
For instance, in cell A3, the ticker symbol shown is for Facebook (FB). Add:
=GOOGLEFINANCE(A3)
into cell B3. The price you receive will likely be different than the snapshot shown above.
In cell F1, the threshold is currently set to 250. Therefore, for the trigger (cell C3) type in the following:
=IF(B3 > $F$1, “Yes”, “No”)
This formula will check the value in $F$1. If you are unfamiliar with the ‘$’ notation, this indicates an absolute address. This means that when you copy any formula that uses the absolute reference to another cell, it will always retrieve the value of F1.
If you removed the ‘$’ notation, each time you copied the formula to a new line, the relative reference would be used (F2, F3, F4, etc.), which in this case, would give you the incorrect results (the rest of the rows in F column would be blank).
After you complete the above steps, you’ll have one line item in row 3, consisting of the Facebook symbol (A3), the latest price for Facebook (B3), and the indicator (C3) to determine whether the price is greater than the threshold ($F$1).
You can simply copy this entire row for each new symbol that you want to test. When you do so, be sure to change the symbol in the A column to reflect the different symbols that you want to test. For this scenario, the first four stocks being displayed are:
- Facebook (FB)
- Microsoft (MSFT)
- Home Depot (HD)
- Agilent (A)
If you were creating an algorithmic trading program (beyond the scope of this article), you could set up buy/sell signals. That activity is much more complicated than what is being shown in this tutorial.
Can This First Scenario Be Considered a Stock Screener?
In reality, using the scenario above will not be particularly useful. It requires you to obtain stock symbols ahead of time to test them against a simple measure, i.e., a threshold for price. However, it can be used as the basis to develop something more sophisticated.
For instance, suppose you wanted to use the above scenario to test out the prices of all the stocks in the S&P 500. You could obtain a list of stocks from a service such as:
https://datahub.io/core/s-and-p-500-companies
Under the Data Files, you will see an option for “constituents” in the Data Files section. You’ll also see a csv option in the downloads section. You can download that CSV file and import it into your Google Sheets document.
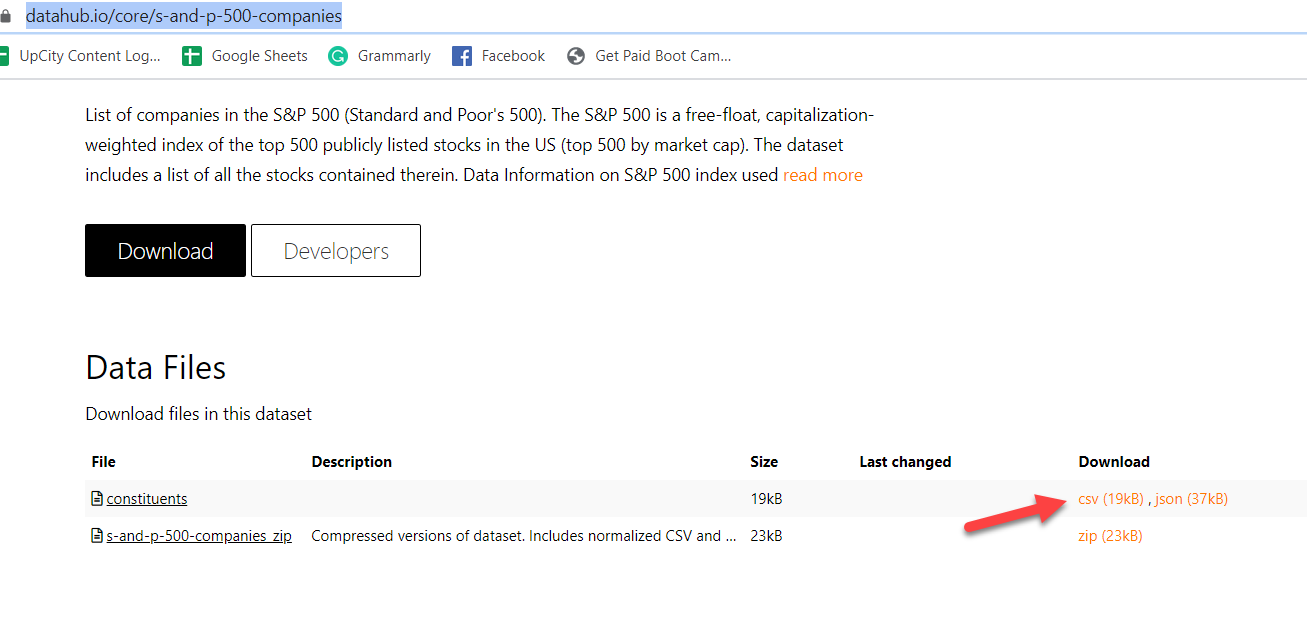
Then, apply the above scenario to find out which companies in the S&P 500 have prices greater than the threshold you set (cell F1). This has already been done in the spreadsheet example, but it’s a good idea to do the exercise yourself.
If you want to go even further with this, you can obtain several more symbols to use:
https://www.tradinggraphs.com/2012/05/06/complete-us-stock-symbols-list-nasdaq-nyse-amex/
Note, though, these companies are listed as of 2012, and companies change often. It’s a good starting point, however.
As you’ll see in the second part of this tutorial, if you want to make this even more sophisticated, you’ll need a data provider that gives you more metrics than =GOOGLEFINANCE() provides. I have searched for several solutions to this end. I have found one that is extremely inexpensive but offers several useful metrics. Best of all, the company offers a free trial for you to test it out.
However, you may be happy enough with the metrics =GOOGLEFINANCE() provides.
Fundamental Data
Screening for stocks based solely on their price is probably not the best metric to use for a stock screener. The price doesn’t mean much on its own. Often, you’ll want to know how that price measures relative to it being overvalued or undervalued.
The topic of valuation is beyond the scope of this article. For the purposes of this discussion, we’ll include the Price-to-Earnings (P/E) ratio and consider that any stock that has a P/E greater than 25 is considered overvalued. The threshold can be changed to whatever you like. This P/E scenario is more realistic and is used by investors.
Scenario 2 – Price/Earnings (P/E) Ratio
For this scenario, you can use the same Google Sheet as you did for Scenario 1. If you copied all the S&P 500 constituent symbols, you’ll have a good data set to work with. If not, you can choose any stock symbols you wish.
Here are the changes to add to the existing Google Sheets:
- Insert a column after the latest price. The idea is to shift the Trigger column over to the right (1 column). Label the new column P/E.
- Rename the original Trigger column (the one you just shifted to the right) to Price Trigger.
- Add a new column called P/E Trigger to the right of the Price Trigger Column.
- In cell G1, type the following (without quotes): P/E >
- In cell H1, type in the following value: 25 – you can change this to any number you want later.
You’ll use the same =GOOGLEFINANCE() function to obtain the stocks' P/E ratios. For cell C3, type the following:
=GOOGLEFINANCE(A3, ‘pe’)
This will retrieve the P/E ratio for the symbol that resides in cell A3. In our example, it is FB (Facebook).
Note: some symbols may appear as N/A. Often, this means that their P/E ratio is undefined for one reason or another. Usually, it means that the stock earnings are negative, and the P/E ratio is meaningless when that is the case.
If you want a more in-depth coverage of using Google Sheets, I wrote a post about the different issues about obtaining market data.
Taking the Concept to a Higher Level
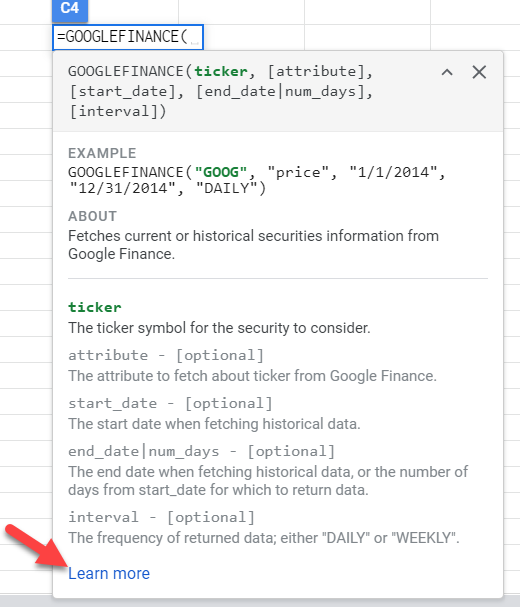
If you want to know all the features of GOOGLEFINANCE(), check out the help in the GOOGLEFINANCE() function. To get to it, simply start typing the command in the proper format, as follows:
=GOOGLEFINANCE(
A popup help screen should appear as you are typing – if it doesn’t, hit the <F1> key, and it should appear.
At the bottom of the popup, you’ll see a link called “Learn More”. Click on that link, and the full help window will appear on the right-hand side of the spreadsheet.
When you scan through the list, you’ll notice it is not comprehensive. It has some indicators that may help with your analysis, but overall, you probably find that it doesn’t report enough measures to make it worthwhile as a stock screener.
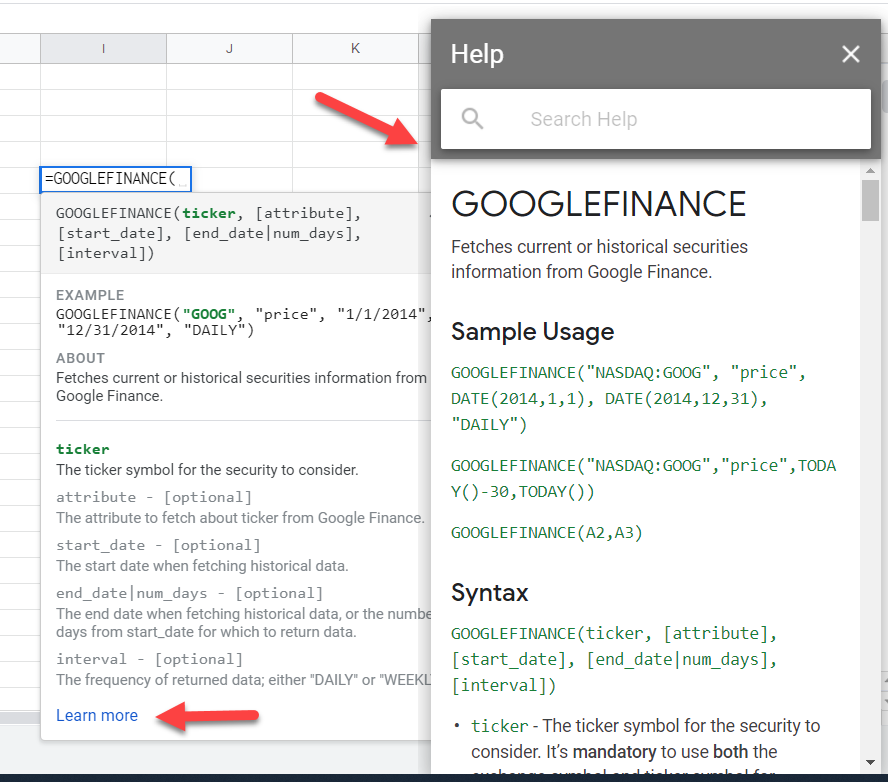
If you feel that the built-in GOOGLEFINANCE() is enough for your needs, feel free to skip the rest of this article.
Introducing Maverick Market
Maverick Market is a service that offers market data (stocks, options, and fundamental analysis). Many financial data providers charge hefty monthly fees in the hundreds or even thousands of dollars a month.
If you want to skip right to the offer for Maverick Market data, you’ll pick up the interface quickly as it is intuitive. The company offers a free 14-day trial without the need to enter credit card details. It’s a sweet deal!
https://maverick.market/?ref=signupnow
Professional traders and money managers don’t even flinch with these high-cost fees. The successful traders make well more than the fees they are charged for their data. Of course, you’ll need to be a great trader to make enough to cover those costs.
But what if you’re not a great trader? Most traders who are starting out won’t be great traders. Therefore, they need reliable market data that is affordable. That is what Maverick Market provides: affordable market data.
While the company has not announced a free tier for their service, they do offer a 14-day free trial. If nothing else, you should sign up to see if the service works for you. Fourteen days is enough to learn the product and see what they provide. You can use this time to develop your stock screener further and then make the decision on whether to continue.
Another benefit of the 14-day trial is you aren’t required to enter your credit card information. In other words, when you sign up and 14 days pass, you don’t need to do anything to cancel your subscription. Just let the subscription lapse. This is a refreshing change from the usual services that require a credit card and then charge people when members forget to cancel.
You Have Nothing to Lose!
It’s worthwhile to try the service for 14 days. You aren’t pressured to upgrade, and you can see just how much data they provide. If you are serious about developing a stock screener, you’ll want to try out the service.
Maverick Market Support
When I signed up, I had questions about the service. Yes, I am a paid member. When I submitted a support email, it was answered within the same day. I don’t know if that is their policy, but that is my experience. Tech support answered my question easily.
Why Maverick Is Perfect for Your Custom Stock Screener
What attracted me to Maverick Market was its ability to retrieve financial statement data points. Yahoo Finance offered this feature but pulled the plug on it in 2017. If you know how to scrape the web (using programming languages), you may still get away with pulling financial statement data from Yahoo Finance.
However, anyone who has experience in web scraping will tell you that it’s a volatile activity. That’s because it depends on filtering data in an HTML stream. HTML is the language that all web pages use for web browsers.
When you use scraping algorithms, you have to reverse-engineer each web page you want to extract information. The biggest problem with this technique is that website owners (like Yahoo Finance) frequently change their web pages.
When they do, the changes often break the scraping code. Each time they do this, you have to reverse-engineer the pages once again and find the information and change your scraping code. It’s a pain-in-the-you-know-what!
Applications Programming Interfaces (API) Are Best Practices for Obtaining Data
Many companies create what is known as application programming interfaces (API). These APIs are commands that can be called within common programming languages. The company publishes a series of commands that can be used to get the appropriate data.
It’s important to realize that Maverick is not a true API. They make their interface available as an Add-on within Google Sheets. Once you install the Add-on, you have commands available that behave like APIs but are not true APIs.
You can think of Maverick’s commands as a hybrid approach between scraping and an API. The impact of this is minimal, however, and a true API could break if a supported data provider ceases to exist or makes changes.
APIs (and Maverick’s hybrid commands) shelters you from having to make any changes that you’d need to do with scraping. Maverick’s commands and APIs may fail to function temporarily. But when they find alternatives, your calls do not change. They simply work.
Unfortunately, if Maverick or API data providers cannot find data alternatives, they may cancel the service. In fact, that is what happened to Maverick before they reinvented their service. Their service was called Sheets Market Data. But the good news is they are back and better than ever.
Another benefit of Maverick over true APIs is that they provide an easy way to retrieve your data. They allow for bulk commands and templates.
What Data Does Maverick Provide?
To go through each data item would not be a worthwhile exercise. There are too many to discuss. The help information from Maverick does a good job of explaining all the data points. However, it is worthwhile to show the categories as of the time of this writing:
- Company Data
- Options Data
- Quotes Data
- Historical Data
- FOREX Data
- Commodities Data
- Economic Data (Not Available Yet)
- Indices
For the purposes of creating a stock screener, the Company Data category is likely to serve our needs best. However, your license to Maverick includes all the categories, so feel free to experiment.
If you are unfamiliar with options trading, you may want to avoid the Options Data section. Options data covers many data points for the different strike prices. You would likely hit your daily limits rather quickly when experimenting with options prices on even just a few stocks.
Company data includes a variety of data points. The subcategories for this are:
- Fundamental Data
- Income Statement Data
- Company Estimate Data
- Company Profile Data
- Balance Sheet Data
- Cash Flow Statement Data
Fundamental Data
Fundamental data has some pricing data, but also includes ratio data like Quick Ratio (quick_Ratio) and Current Ratio (current_Ratio). It’s a bit of a hodge-podge of items but could be useful, nonetheless.
Income Statement Data
One of the financial statements' components, the income statement, holds temporary accounts for a given accounting period. These temporary accounts move into the balance sheet after the close of the accounting periods.
Income statement data deals with revenues and expenses. After all, expenses are subtracted from the revenues, what is left over is the earnings. The various categories of revenues and expenses are included in Maverick.
Company Estimate Data
If you pay attention to Wall Street analysts, you may find this section useful. It reports earnings estimates, revenues estimates, EPS trends, and revisions.
Company Profile Data
Perhaps the most useful aspect of this subcategory is the industry and sector. The address of the company can usually be found anywhere on the internet.
Balance Sheet Data
A balance sheet is a snapshot of a company’s financial position. The tracking of balance sheet data is ongoing for the life of the firm. During the close of any accounting period, the income statement information is rolled into the balance sheet.
The components of the balance sheet comprise the accounting statement. Namely,
Assets = Liabilities + Shareholder’s Equity
The left side is where assets are recorded. The right side is where the liabilities and shareholder’s equity are recorded. The value of the assets must balance with the values of the liabilities and equities. This is how the balance sheet gets its name.
Cash Flow Statement Data
The cash flow statement tracks the inflows and outflows of cash. The three main sections of the cash flow are reported in Maverick, which are operating cash flows, investing cash flows, and financing cash flows.
Next Steps…
You have all the tools you need to start creating a decent stock screener. The best part of doing it yourself is that you get to control what goes into it. You may not have all the bells and whistles of many of the online screeners. But most often, having too many metrics is a distraction. When you focus on the aspects of investing that matter to you, then you can implement your system as you see fit.
Maverick.Market is a great tool to help you accomplish the creation of a custom stock screener. Signing up for a free 14-day trial is a no brainer. You don’t need a credit card to sign up. And if you decide to continue with them, they are wickedly inexpensive for what you get. However, you’ll need to act soon, because the website offer suggests the price is going up.

And if you decide to continue with them, they are wickedly inexpensive for what you get. However, you’ll need to act soon, because the website offer suggests the price is going up.

