
Discounted Cash Flow (DCF) analysis is the backbone of intrinsic value investing. But building one by hand means hunting down five to ten data points per company before you even start. Here are four free ways to run a DCF, ranked from “most typing” to “type nothing at all.”
Disclosure: This post contains affiliate links to Stock Analysis (marked below). If you sign up through one of these links, I may earn a commission at no extra cost to you. I use and recommend this tool because it’s the one I actually built my own DCF workflow around.
What a DCF Actually Needs
Before comparing tools, it helps to know what a DCF model requires. At minimum, you need:
- Free cash flow (FCF) — usually the starting point, per share or in aggregate
- A growth rate for the next several years (often split into a “high growth” period and a “fade” period)
- A terminal growth rate — what the company grows at forever after your forecast window
- A discount rate (WACC) — the annual return you require, which shrinks future cash flows back to today’s dollars
- Shares outstanding, cash, and debt — to bridge from enterprise value to a per-share number
That’s six to eight individual figures, and most of them (WACC, growth estimates, historical FCF) aren’t sitting in one place — you’re pulling them from 10-Ks, analyst estimates, and cash flow statements. This is where the four tools below start to differ a lot.
1. Market Fair Value – Free DCF Calculator
Link: marketfairvalue.com/dcf-calculator
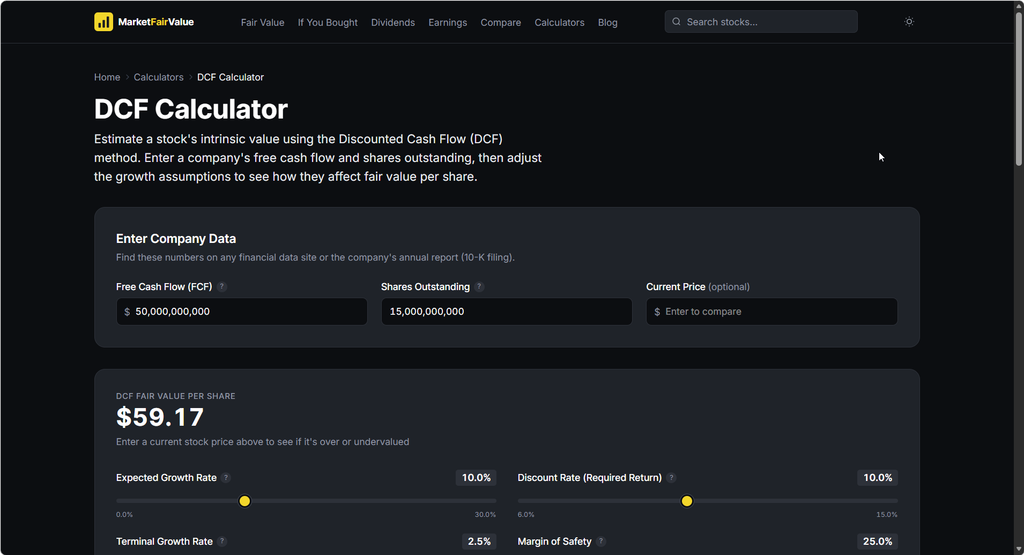
This one is a clean, no-registration calculator built around a two-stage DCF model. You manually enter free cash flow, shares outstanding, an optional current price, a growth rate, a discount rate, a terminal growth rate, and a margin of safety, and it renders a 10-year projection table plus a fair value estimate. marketfairvalue
It’s a solid, simple tool for understanding the mechanics — but every single number above has to come from somewhere else first. You find the company’s FCF and enter it.
2. Business Initiative – DCF Valuation Calculator
Link: businessinitiative.org/tools/calculator/dcf-valuation
This is a more feature-heavy version of the same idea, with scenario toggles (Base Case, Optimistic, Conservative, Stress Test) layered on top. You’ll manually fill in current free cash flow, a growth rate, the forecast period length, terminal growth rate, discount rate/WACC, net debt, and shares outstanding.
More inputs mean more precision if you already have the numbers. But also more places to make a mistake, and more time spent digging through filings before you can even see a result.
3. Over Calculator – DCF Calculator
Link: overcalculator.com/calculators/dcf
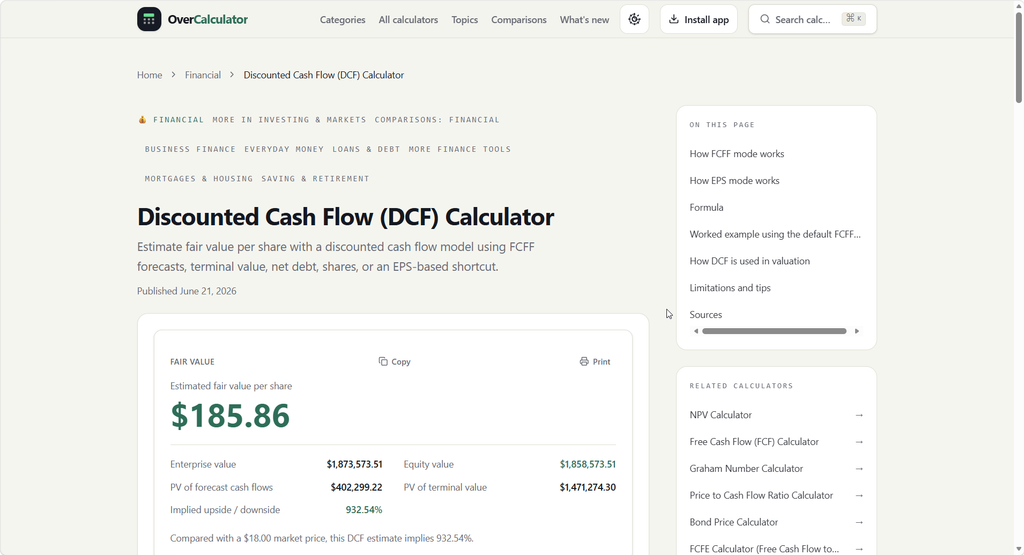
This is the most data-hungry of the three manual tools. Instead of one FCF figure, it wants year-by-year free cash flow to the firm (FCFF) forecasts for each of five years, plus a growth rate, discount rate/WACC, cash, outstanding debt, outstanding shares, and market share price. It requires nine separate fields before it gives you a number. There’s also an EPS-based shortcut mode if you don’t want to build a full FCFF forecast, but the full mode is genuinely the most granular of the four tools here.
It’s a good tool if you enjoy building your own year-by-year forecast. But it also means you’re the analyst and the data provider.
4. My Vibe-Coded DCF Tool (GitHub), and Why It Still Needs Stock Analysis
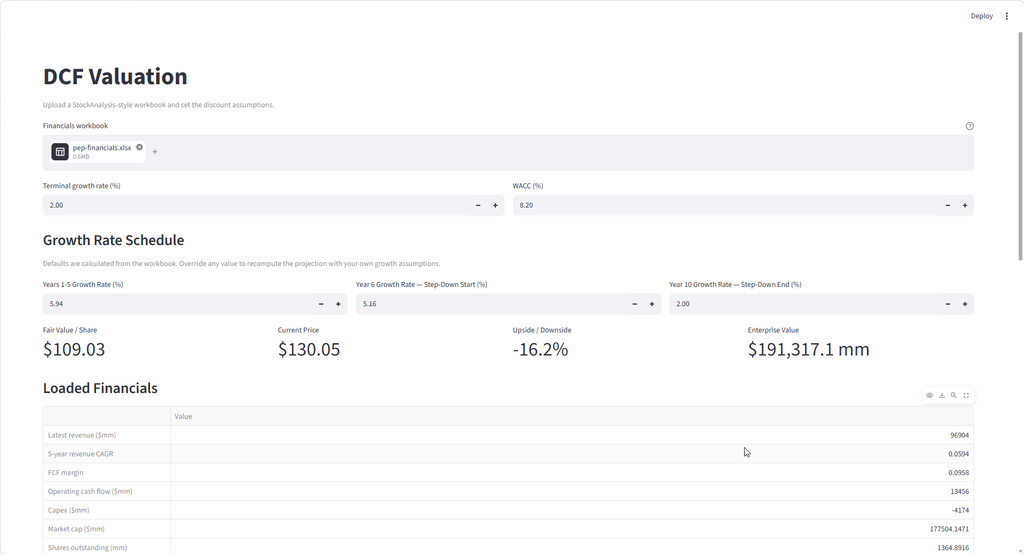
Link: github.com/techhound/streamlit-dcf
This is a Python/Streamlit app I built myself. Unlike the three calculators above, it’s not something you fill in field by field. You upload a StockAnalysis Excel workbook, and it automatically extracts the financial statement data, calculates a 5-year historical revenue CAGR and FCF margin, and pre-fills growth-rate inputs for you. You only need to set WACC and a terminal growth rate manually. Revenue, operating cash flow, capex, cash, debt, market cap, and share price come straight out of the workbook.
The DCF tool I vibe-coded requires data from a Stock Analysis export. On the surface, that seems restrictive. But it’s more about convenience. If you decide to subscribe to Stock Analysis (downloading data requires a paid subscription; see below), you’ll have all the data in the right format.
Here’s the so-called twist in the post. If you aren’t interested in subscribing to Stock Analysis for your data, you can vibe-code my solution yourself to fit your data feed. Or you could ask for the spreadsheet format it is currently downloaded in and rearrange your data to match it. AI can help with that too (it can write a conversion program for you).
My goal isn’t to force anyone into unwanted subscriptions. If you analyze stocks, or plan to, though, you’ll find that Stock Analysis has a lot to offer at one of the most affordable pricing tiers in the industry. I’ve been in the finance industry for several years, and I can tell you it is the best for the price.
The Real Problem: Where Does the Data Actually Come From?
Look back at tools 1–3. Every single one puts the burden on you to find:
- Free cash flow (from the cash flow statement)
- Historical growth rates (from several years of filings)
- A reasonable WACC (which itself requires a risk-free rate, beta, and cost of debt)
- Shares outstanding, cash, and debt (from the balance sheet)
You have three realistic options for finding all of that:
- Dig through 10-Ks and 10-Qs yourself – free, but slow. Pulling five years of clean historicals for one company can eat 20–30 minutes, and you’re doing it again for every stock you want to check.
- Use a free aggregator site – faster, but you’re often missing forward growth estimates, WACC, or consistent historical information, and formatting varies wildly from site to site.
- Pay for a premium data terminal – accurate and fast, but many of the well-known options run well into the hundreds of dollars per month, which is a hard sell if you’re not managing serious capital.
None of those are great if you just want to run a DCF on a small number of stocks a week.
The Crux: Stock Analysis’s DCF Calculator Prefills Everything
Link (affiliate): Stock Analysis DCF Calculator Tutorial · Try it directly on Walmart (WMT)
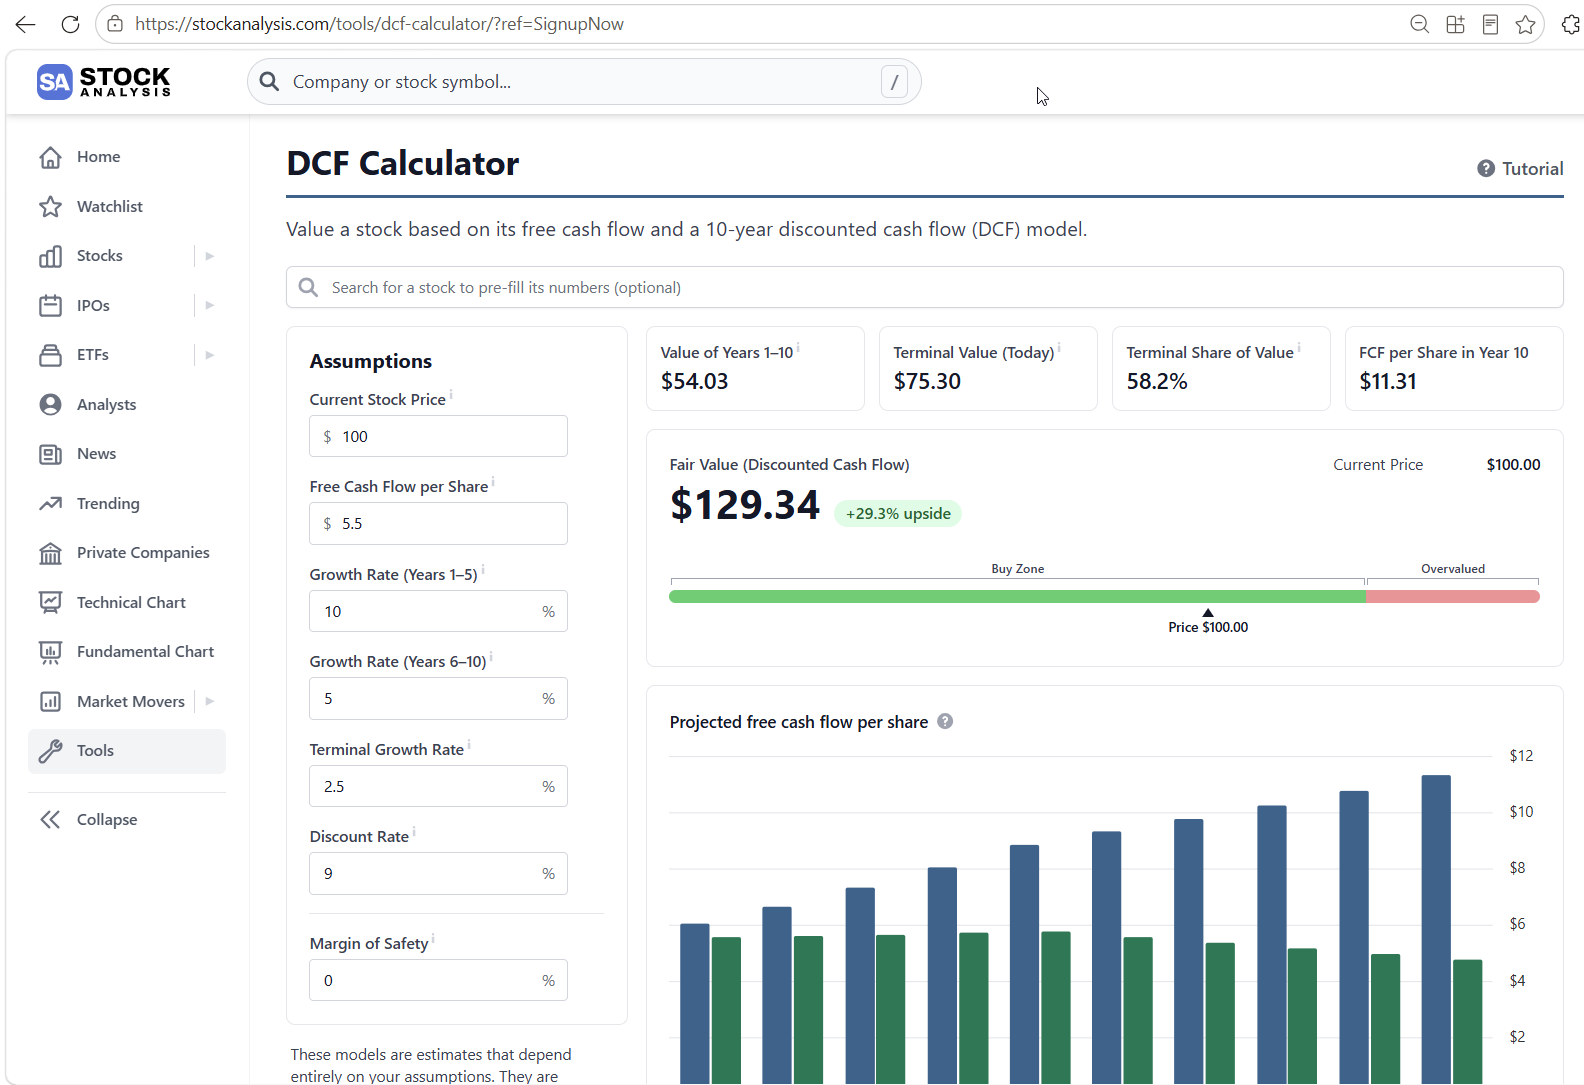
Stock Analysis (SA) is, at its core, a data company, so instead of asking you to hunt down inputs, its DCF Calculator starts with them already filled in. Type a ticker into the search box, and it automatically fills in the stock’s current price, free cash flow per share, analysts’ expected free cash flow growth, and WACC. There’s no “Calculate” button because there’s nothing left to enter. The fair value updates live as you adjust any of the five assumption fields. stockanalysisstockanalysis
A few details that make it more than a toy calculator:
- It shows its work. The results break the fair value into the value of years 1–10, the terminal value, the share of total value from that terminal value, and the projected FCF per share in year 10. You can see exactly where the number is coming from, not just trust a single output. stockanalysis
- Built-in sensitivity testing. A table shows fair value across a range of discount rates and terminal growth rates, so you can see how much a single percentage point moves the answer instead of anchoring on one static figure. stockanalysis
- It flags when a DCF is the wrong tool. If a company’s cash flow is expected to turn negative, the calculator shows a “Heads up” warning and switches to using EPS growth instead, with a link to a better-suited Fair Value Calculator. stockanalysis
- Margin of safety built in. You can shave a percentage off the fair value directly in the tool to build in a cushion, rather than doing that math yourself afterward.
- Free to use, no account needed to run a calculation and get a fair value on any of its covered stocks.
This is also exactly what feeds my GitHub tool above: SA’s underlying financial data lets that tool pre-fill growth rates and margins instead of asking you to type them in from a 10-K.
Where the Free/Paid Line Actually Sits
The DCF calculator itself is free to use with no account. SA’s paid tiers come in when you export data, which is exactly what a tool like my Streamlit app needs to run if you want to download financials to Excel/CSV/Google Sheets (or sync a brokerage account, save screeners, or go ad-free); that requires Pro or Unlimited.
Here’s the actual pricing, pulled straight from Stock Analysis:
| Free | $0 | Full site access, ad-supported, no exports |
| Pro | $6.58/mo billed annually ($79/year), or $9.99/mo month-to-month | Unlimited access to all data on 130,000+ stocks and funds, full financial and dividend history, 1 download/day, up to 100 active alerts, brokerage sync, dark mode, no ads |
| Unlimited | $16.58/mo billed annually | Everything in Pro, with unlimited downloads, unlimited watchlist size, and unlimited alerts |
For context: Pro is capped at one download per day and 100 holdings per watchlist; Unlimited removes both caps. Unless you’re exporting data on dozens of tickers daily, Pro covers most individual investors’ needs, active or casual. stockanalysis
If you’re already spending time or money pulling together DCF inputs from multiple free sites each week, $6.58–$16.58 a month is a pretty low bar, especially if you’re an active investor or plan to become one. And the risk is low: Stock Analysis offers a 60-day, no-questions-asked money-back guarantee — email support, and you get a full refund. stockanalysis
If you sign up, use code FME for 10% off.
Quick Comparison
| Market Fair Value | Manual, 5–6 fields | None | Free |
| Business Initiative | Manual, 7–8 fields | None | Free |
| Over Calculator | Manual, 9+ fields (year-by-year FCFF) | None | Free |
| My GitHub DCF Tool | Upload only — still needs an SA export | Growth rates, FCF, cash, debt, shares | Free tool, but needs SA data |
| Stock Analysis DCF Calculator | None — just pick a ticker | FCF/share, growth, WACC, price | Free to use; Pro from $6.58/mo for exports |
FAQ
Do I need to pay to use the Stock Analysis DCF Calculator?
No — the calculator itself is free and doesn’t require an account. You only need a paid Pro or Unlimited plan if you want to export the underlying data, such as feeding it into a tool like a custom Python model. stockanalysis
Can I run a DCF without knowing a company’s WACC?
Yes, if you use a tool that estimates it for you. Manual calculators (Market Fair Value, Business Initiative, Over Calculator) leave WACC entirely up to you to calculate or look up. Stock Analysis’s calculator automatically starts WACC from the company’s own weighted average cost of capital. stockanalysis
Why does my GitHub DCF tool still need Stock Analysis?
Because the tool has no data of its own—it reads a StockAnalysis Excel workbook to extract revenue, cash flow, capex, cash, debt, and share data. Without that export, the app has nothing to load. github
Is a 1% change in discount rate really that significant?
Yes. A single percentage point on the discount rate can move the fair value by 15% or more, which is why sensitivity tables matter more than trusting one static number. stockanalysis
REMEMBER to use Coupon Code FME for a 10% discount on Stock Analysis.




Be First to Comment