
You read about a company that has announced its earnings, and alongside the earnings number, it announces the profit margin. Is the number they report healthy for the company, or is it a sign the company is in trouble?
Profit margin is no doubt one of the most crucial measurements for the company and for investors. But it’s difficult to pinpoint an exact threshold that constitutes “healthy”. That’s because an ideal baseline is different for each industry.
Site owner may receive a commission from purchases made via the links on this page.
We’ll go over how to determine a healthy profit margin below. But first, it pays to know what the profit margin calculation entails.
Profit Margin = Net Income divided by Revenue
The result is almost always in a percentage format. Essentially, it indicates how much net profit a company gained from the revenue reported. Unrealistically, if you had Net Income of 100 and Revenue of 100, you’d have a profit margin of 100%. While not entirely impossible, the likelihood of this happening is near zero. In fact, many companies have profit margins well below 50% and still may be considered healthy.
What about 25%? Is that considered healthy for a company? 18%? 2%?
Luckily, figuring out where this number should be is attainable, and it is a worthwhile exercise to find it.
Finding Competitors
The trick is to gather competitors’ profit margins and then compare your target company against them. You also compare your target company against the average of all.
What’s the Catch?
The biggest catch here is figuring out which companies constitute competitors. Microsoft certainly competes with Apple on operating systems but not on cloud services. Microsoft does compete with Amazon on cloud services, but it doesn’t sell books or products in the same capacity that Amazon does.
This is not foolproof, but sometimes, companies will discuss competitors in their 10-K reports.
You may find services online that show the competitors of your target companies. But they don’t often evaluate them through the lens provided previously (the Apple vs. Microsoft and Microsoft vs. Amazon, etc.).
Overall, though, you can use the list of competitors given by online services. It will be good enough for an overall evaluation. Just be aware that it’s not a perfect comparison, and be sure to include any caveats to avoid getting called out about it (if you publish your work)
What About Other Measures?
If you were thinking that we don’t have to stop at profit margin when comparing companies, you’d be correct. Analysts often compare a whole lineup of measures in peer comparisons. Otherwise, it’s an apples-to-oranges comparison, although some measures can still compare usefully across different industries (again with caveats).
One Method that Works (though not perfectly)
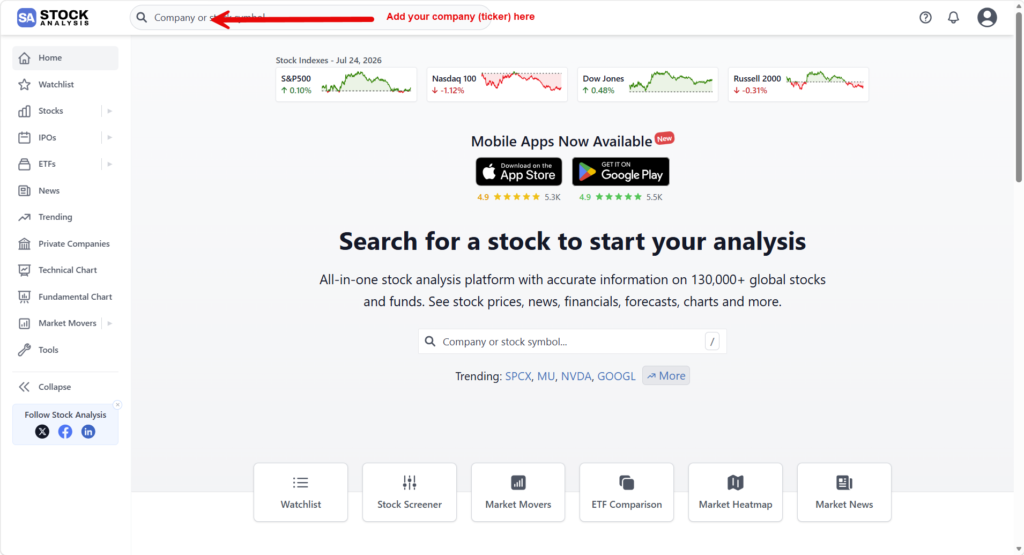
Stock Analysis breaks out companies by industry. Go to the main page of Stock Analysis and enter your target company. For this example, we’ll use Microsoft $MSFT.
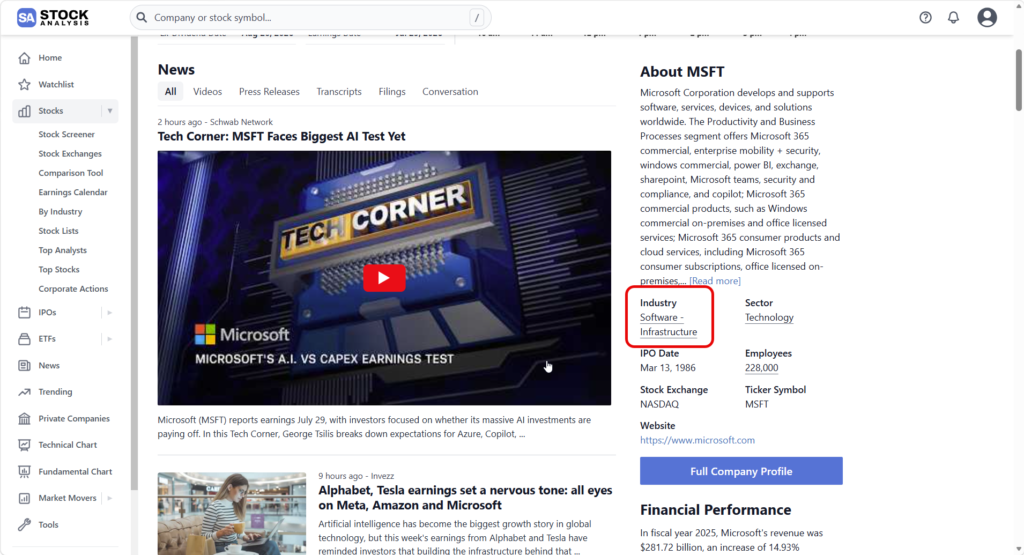
Scroll down to the mid (to lower) right-hand part of the screen and click on industries. Stock Analysis will list all the companies that belong to that industry.
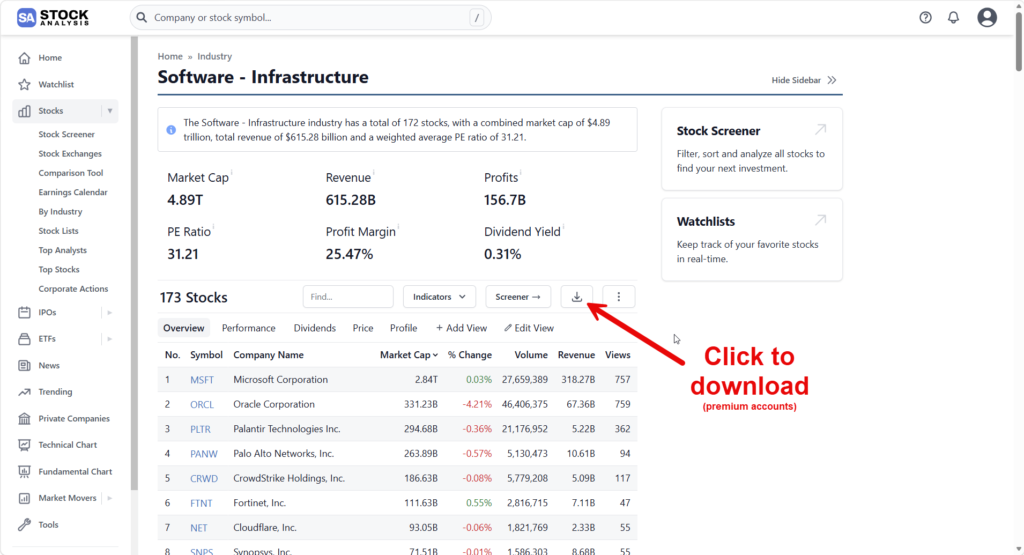
Click on the download button (note: you will need a premium account for this). This will save all the items to your download folder.
Open up your favorite LLM (ChatGPT, Claude, etc.) and upload the list. Ask the LLM to rate the competitiveness strength of the top 20 (or 30, etc.) companies. Here is the prompt I used:
Please rate the strength of competitors against MSFT for the first 20 or so companies on the list (scale of 1-100)
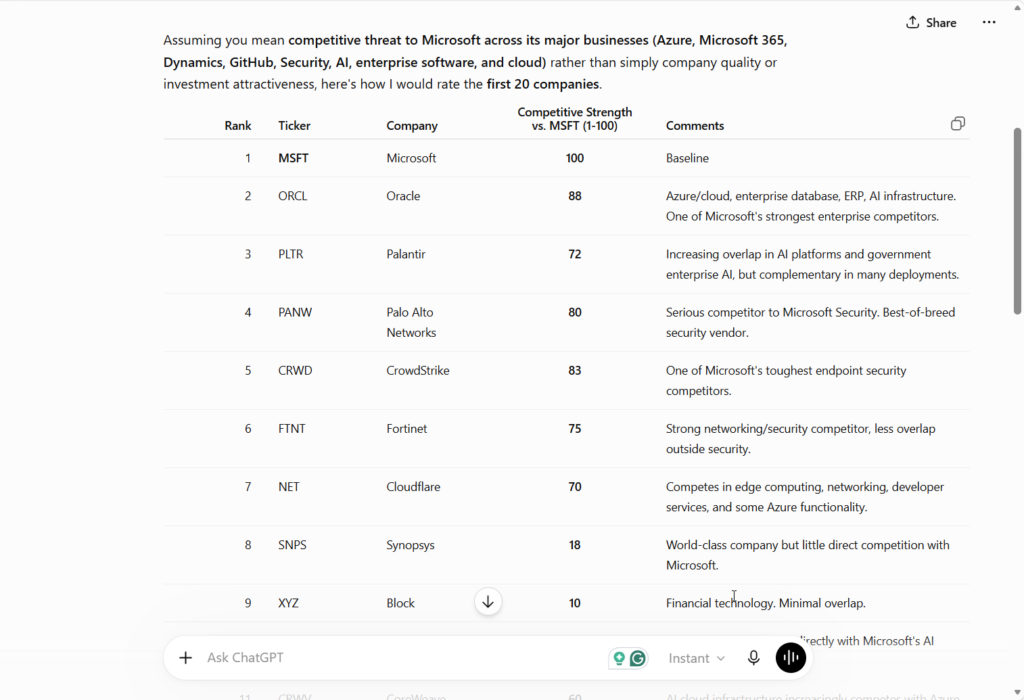
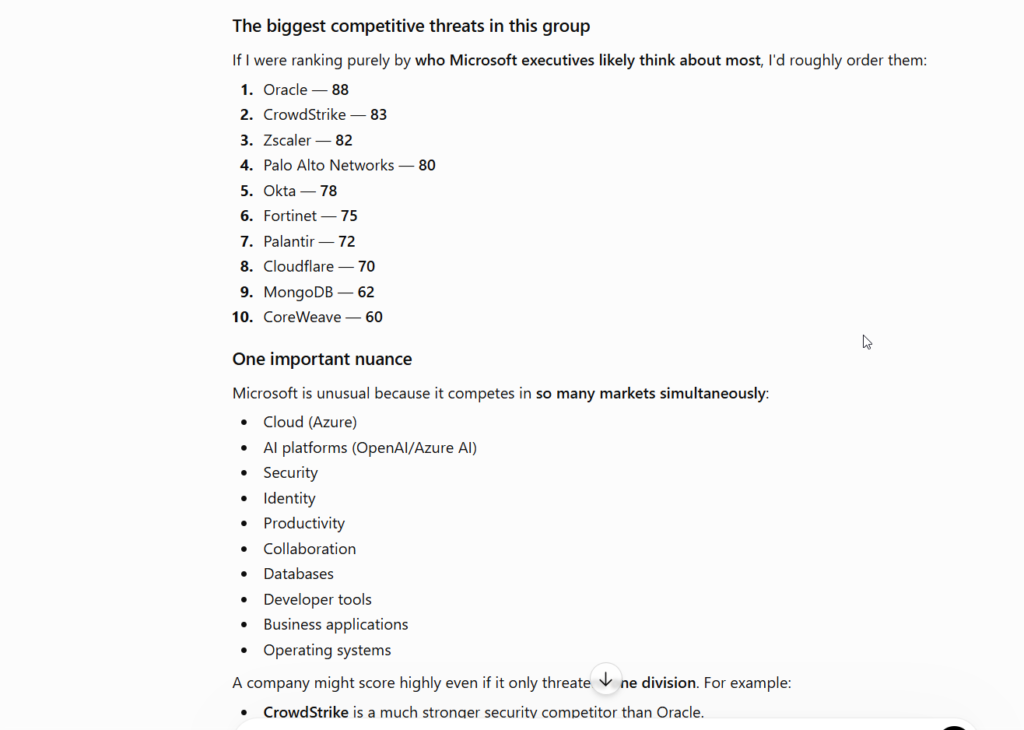
Note that I did not ask for ChatGPT to summarize the top 10 (I’m glad it did, anyway). So if that’s something you want to have happen and the LLM didn’t do it, follow up with instructions to do so.
As the header of this section stated, this does work but is not perfect. It can be close enough for analysis but just know that it isn’t perfect.
Sign up for Stock Analysis, and you’ll be able to use this technique to get competitor data for your analysis. Use the COUPON CODE: FME for 10% off.



Be First to Comment