
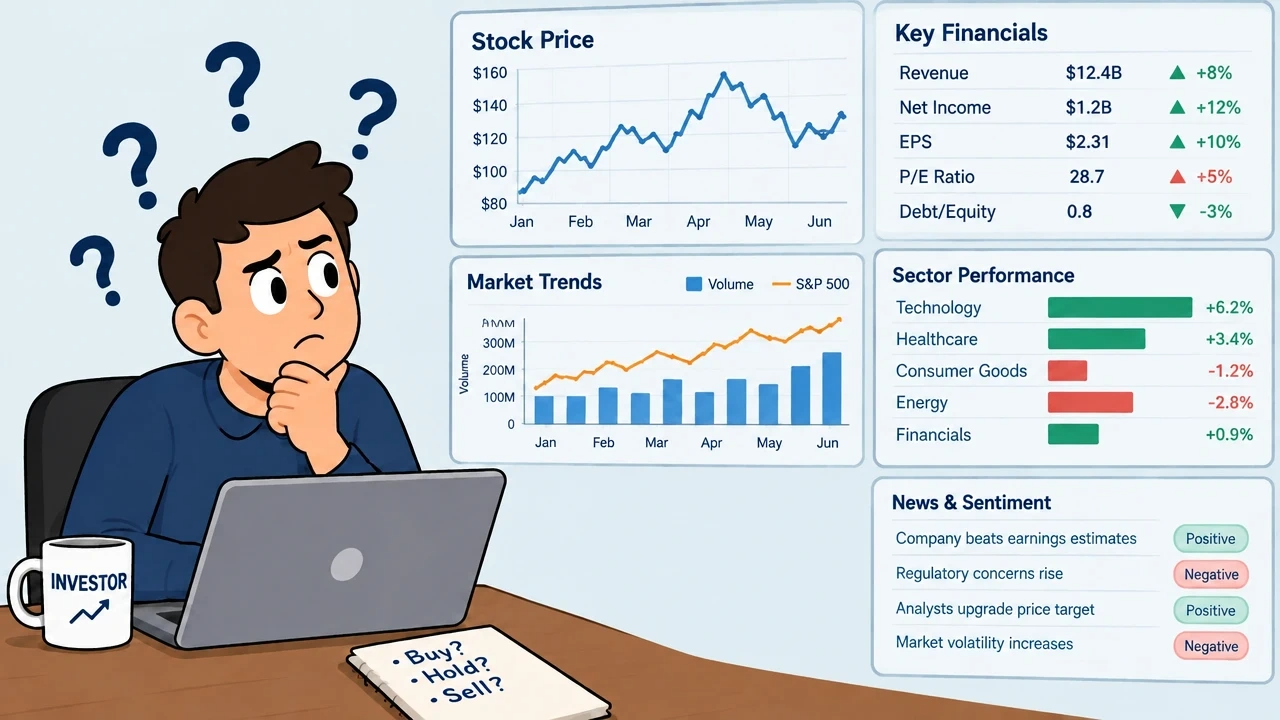
Twenty years ago, an individual investor who wanted a company’s financial statements had to request a paper annual report or drive to a library. Today you can pull a decade of income statements, balance sheets, and cash flow data in under a minute, for free. Screeners, SEC filings, and earnings transcripts are all a click away.
Yet most individual investors still make decisions on headlines, hunches, and a stock’s recent price chart. Access to data was never the real gap between institutions and individuals. The gap is knowing what to do with it.
Professional analysts don’t have secret numbers. They have a process: a repeatable way of turning raw figures into questions, and questions into decisions. You can build that process too.
Step 1: Begin With a Question, Not a Spreadsheet
The most common mistake is opening a pile of data and hoping it tells you something. Data without a question is noise. Before looking at a single number, decide what you’re trying to learn:
- Is this business actually growing, or just getting bigger through acquisitions or debt?
- Does it make real money, or only accounting profit?
- Could it survive a bad year?
- Is the price I’m paying reasonable for what I’m getting?
Each question points you to a specific part of the financial statements. That’s how professionals avoid drowning in data.
Step 2: Read the Three Statements as One Story
The income statement, balance sheet, and cash flow statement are chapters of the same book.
- The income statement tells you whether the business is profitable and how that trend is moving.
- The balance sheet tells you what it owns, what it owes, and how fragile or sturdy it is.
- The cash flow statement tells you whether the profits are real.
Related: Understanding the Income Statement: A Beginner’s Guide
The most useful habit you can build is cross-checking them. If net income is rising but operating cash flow is flat or falling, ask why. Receivables may be ballooning because the company is booking sales it hasn’t collected. Inventory may be piling up. Accounting choices can shape earnings, but cash is much harder to dress up. When profit and cash tell different stories, trust the cash and investigate the gap.
Related: Financial Statement Analysis: Techniques for Balance Sheet, Income & Cash Flow
Step 3: Use Ratios as Tools for Comparison
A single number means little in isolation. A 15% operating margin is excellent in one industry and mediocre in another. Ratios become useful in two ways: against the company’s own history, and against its direct competitors.
A starter toolkit:
Profitability
- Operating margin: how much of each sales dollar survives after the costs of running the business.
- Return on invested capital (ROIC): how efficiently management turns capital into profit. Consistently high ROIC is often the signature of a quality business.
Related: What Makes a Healthy Profit Margin for a Company?
Financial health
- Debt-to-equity and interest coverage: how leveraged the company is, and whether earnings comfortably cover interest payments.
- Current ratio: whether near-term assets cover near-term obligations.
Cash generation
- Free cash flow (operating cash flow minus capital expenditures): the money left over for dividends, buybacks, debt paydown, or reinvestment.
- Free cash flow margin and conversion: how much of reported profit becomes actual cash.
Valuation
- Price-to-earnings, price-to-free-cash-flow, EV/EBITDA: what you’re paying relative to what the business produces.
The direction of travel matters more than any one year’s reading. A company whose margins have slowly improved for five years tells a very different story from one with the same margin today but a declining trend.
Related: How to Calculate DCF (Discounted Cash Flow): 4 Free Tools Compared
Step 4: Look for Trends, Not Snapshots
Institutions have teams that model quarter-by-quarter movements. You can capture most of the value with something simpler: put five to ten years of key metrics side by side and look at the shape.
Ask yourself:
- Is revenue growth steady, accelerating, or fading?
- Are margins expanding, holding, or eroding?
- Is debt rising faster than earnings?
- Is share count shrinking (buybacks) or quietly growing (dilution from stock compensation)?
One strong year can be luck. Five consistent years suggest something durable. Cyclical businesses like energy, materials, and homebuilders need extra care: peak-year numbers can make a stock look cheap right before the cycle turns.
Step 5: Turn Numbers Into a Valuation Range, Not a Prediction
Data tells you about the past. Investing is about the future. The bridge is a reasoned estimate of what the business might be worth, and the honest version of that is a range, not a single number.
A practical approach:
- Estimate a conservative, base, and optimistic case for growth and margins.
- Apply a reasonable valuation multiple to each, or run a simple discounted cash flow.
- Compare the results to today’s price.
If the stock only looks attractive under the optimistic case, you’re being asked to pay for perfection. If it looks reasonable even in the conservative case, you have a margin of safety, which is the closest thing investing has to a free lunch. The goal isn’t precision. It’s knowing what has to go right for the investment to work.
Step 6: Understand What the Numbers Can’t Tell You
Financial data is powerful but incomplete. It won’t directly capture a brand’s strength, management quality, regulatory risk, or a technological threat on the horizon. Read the footnotes, the risk factors, and the management discussion in the 10-K. Read earnings call transcripts and notice what executives avoid addressing. The numbers show what happened. The qualitative work helps explain why, and whether it will continue.
Step 7: Build Rules Before You Need Them
Even good analysis fails if emotion overrides it. Institutions have investment committees, risk limits, and checklists partly to protect themselves from their own impulses. You can do the same on your own:
- Write down why you’re buying, and what would make you sell.
- Set position-size limits so no single idea can sink you.
- Use a checklist so you apply the same standards every time.
- Keep an investment journal and review your past decisions honestly.
The journal is arguably the most underrated tool available to individuals. It turns every decision, right or wrong, into data about your own behavior.
Where Individual Investors Actually Have an Edge
Institutions have scale, research budgets, and speed. But they also face constraints you don’t: quarterly performance pressure, benchmark-hugging, size limits that keep them out of smaller companies, and committees that discourage original ideas. You can hold a position for years, ignore the quarterly noise, buy small companies too tiny for a large fund, and wait patiently for the right price.
Time horizon and patience are among the few advantages that are structurally simpler for individuals to exploit, and good analysis makes them far more valuable.
The Bottom Line
You don’t need a Bloomberg terminal to invest well. You need a question, a method, and the discipline to follow both. Start with one company you already understand. Read its statements as a story. Compare the ratios to its peers and its own history. Build a valuation range. Write down your thesis. Then repeat.
The data has been available to you for years. The edge goes to the investor who learns to use it.
Related: One Trick to Help You Locate Financial Data
This article is for educational purposes only and isn’t customized investment advice. Consider your own situation and consult a licensed professional before making investment decisions.
I can also put this into a formatted document or add a one-page checklist version of the seven steps if you’d like.






Be First to Comment