Should You Use Paper Trading to Learn About Investing?
By James Cochrane on July 31, 2026
Everyone has an opinion on paper trading. Those who believe in the efficacy of the practice will tell you that you can learn the ropes of investing, so to speak. Proponents will tell you that it can never capture the essence of real trading. Which side is correct?
Essentially, both views are correct. You can learn the dynamics of investing as long as you know it does not capture the emotional swings of real trading. And that makes sense, since you react differently when you have real money pledged into the market. You feel the dips hard, and you are more elated by the surges.
Site owner may receive a commission for products purchased through links on this website.
Is Paper Trading Even Worth the Effort?
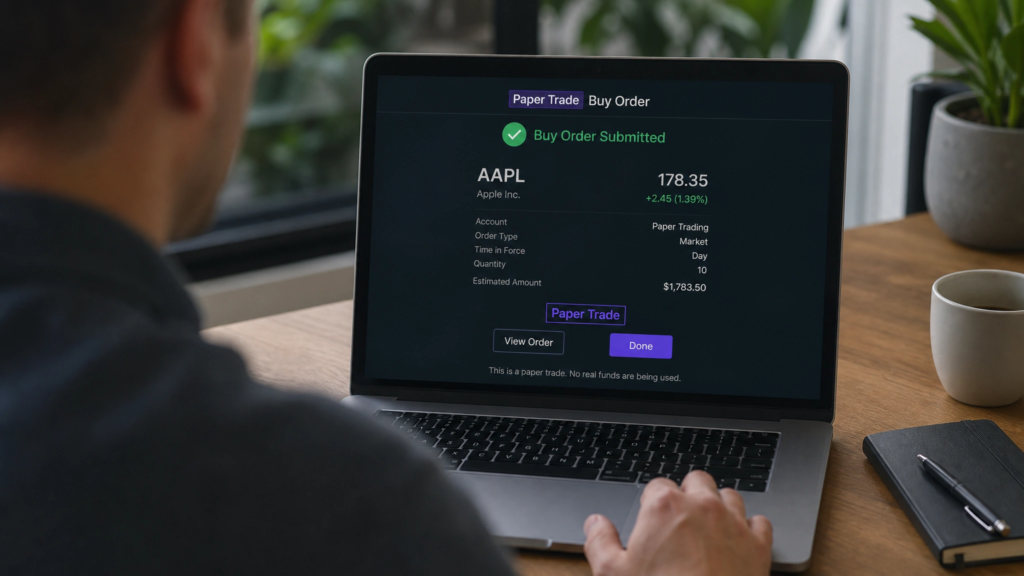
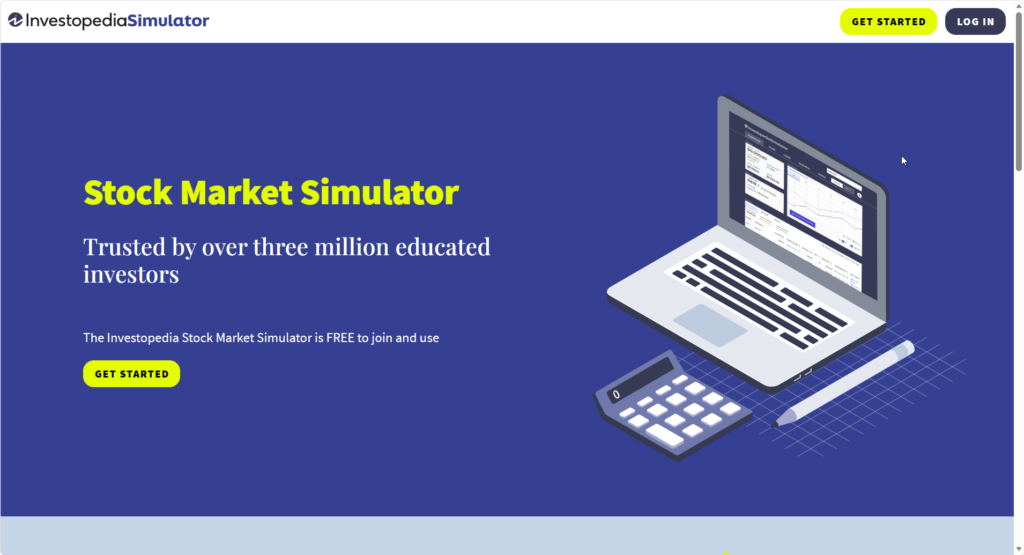
If you haven’t heard the term, you can set up a mock account with your brokerage or other services that offer paper trading platforms (like Investopedia.com), and you can start making faux trades. The advantage is that stocks are real and the prices are close to what you might pay for real trades. Further, the platform will keep track of your trades and how you are doing.
Some services, like Investopedia.com, even offer contests where you can win money if your portfolio performs the best over the allocated time of the contest. After you sign up for the platform, you create a portfolio (or a new contest, if that’s how you want to participate and they offer that feature). Then, you learn how to enter buy and sell orders, very much the way you would do it if you were trading real money.
As to whether paper trading is worth it, it will depend on a few factors:
You are brand new to trading in the stock market and are apprehensive about using the trading platform.
You want to test out certain strategies before committing real capital.
You need to build a trading plan and develop the discipline to follow it.
It helps you understand how much or little you know about investing.
Some drawbacks to paper trading include:
It does not create the same stressful situation that real trading does, which means it is not emulating the true environment you would face when real money is on the line.
A false sense of security. Suppose you did really well with paper trading. Does that mean you’ll do well when trading with real money? There is no guarantee of this success whatsoever. That’s why it’s important to understand the nuances of paper trading.
Trade executions won’t match real trades. However, for popular stocks, you will likely come close.
With paper trading, if things don’t go well, you can simply walk away from the account or close it out. That option is not available with real trades, unless you decide to move your money to another broker, which won’t necessarily help towards your success in trading.
Other Alternatives
Some investors like to use backtesting to test trades and techniques. While backtesting can be effective, it assumes that past price behavior will be repeated. Some patterns can and do repeat, but it is hardly ever an exact match. This fact can also lead to a false sense of accomplishment. If you pick up on a pattern that may have worked a few times in the past, you may be tempted to overextend the size of your trades to go for the “big win”.
If you decide to try backtesting, you’ll need data to work with. You can download historical price data on Yahoo Finance, but they constantly change the data points that they include (because they give free access). And I have seen instances where they completely removed access to financial statement data.
Another affordable option for data is Stock Analysis. I have been using them consistently for almost a year now. They keep adding new great features, and for most stocks, you can download several years of financial data (premium plans). If you decide to sign up for a premium plan, be sure to use the COUPON CODE FME for 10% off.
How to Implement Paper Trading
The following are guidelines that can help if you decide to implement paper trading into your financial routines:
Set up your portfolio with a budget that matches your real budget. Although the emotions associated with paper trades are not the same as real trades, you can still get a feel for size positioning.
Keep a log of your trades. If you discover methods that seem to be working, you’ll want to use them in your active trades.
Continually understand that the trades will not have the same financial impact as real trades. I know we’ve been through this one several times, but it can’t be overemphasized.
Have fun and continue learning.
Join competitions when available. These contests often have decent cash prizes.
Paper trading is a useful tool that helps investors understand the trading process and gives a platform for testing ideas. Use it as a stepping stone towards better trading results, not as a substitute. Always continue to learn about investing (even outside of paper trading) and, when trading for real, use proper money management and position-sizing.
You read about a company that has announced its earnings, and alongside the earnings number, it announces the profit margin. Is the number they report healthy for the company, or is it a sign the company is in trouble?
Profit margin is no doubt one of the most crucial measurements for the company and for investors. But it’s difficult to pinpoint an exact threshold that constitutes “healthy”. That’s because an ideal baseline is different for each industry.
Site owner may receive a commission from purchases made via the links on this page.
We’ll go over how to determine a healthy profit margin below. But first, it pays to know what the profit margin calculation entails.
Profit Margin = Net Income divided by Revenue
The result is almost always in a percentage format. Essentially, it indicates how much net profit a company gained from the revenue reported. Unrealistically, if you had Net Income of 100 and Revenue of 100, you’d have a profit margin of 100%. While not entirely impossible, the likelihood of this happening is near zero. In fact, many companies have profit margins well below 50% and still may be considered healthy.
What about 25%? Is that considered healthy for a company? 18%? 2%?
Luckily, figuring out where this number should be is attainable, and it is a worthwhile exercise to find it.
Finding Competitors
The trick is to gather competitors’ profit margins and then compare your target company against them. You also compare your target company against the average of all.
What’s the Catch?
The biggest catch here is figuring out which companies constitute competitors. Microsoft certainly competes with Apple on operating systems but not on cloud services. Microsoft does compete with Amazon on cloud services, but it doesn’t sell books or products in the same capacity that Amazon does.
This is not foolproof, but sometimes, companies will discuss competitors in their 10-K reports.
You may find services online that show the competitors of your target companies. But they don’t often evaluate them through the lens provided previously (the Apple vs. Microsoft and Microsoft vs. Amazon, etc.).
Overall, though, you can use the list of competitors given by online services. It will be good enough for an overall evaluation. Just be aware that it’s not a perfect comparison, and be sure to include any caveats to avoid getting called out about it (if you publish your work)
What About Other Measures?
If you were thinking that we don’t have to stop at profit margin when comparing companies, you’d be correct. Analysts often compare a whole lineup of measures in peer comparisons. Otherwise, it’s an apples-to-oranges comparison, although some measures can still compare usefully across different industries (again with caveats).
One Method that Works (though not perfectly)
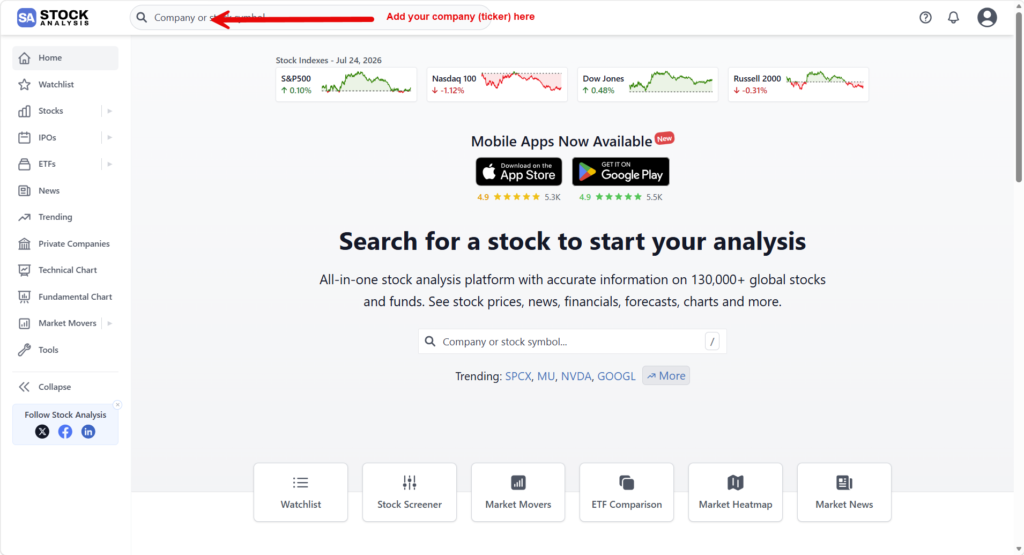
Stock Analysis breaks out companies by industry. Go to the main page of Stock Analysis and enter your target company. For this example, we’ll use Microsoft $MSFT.
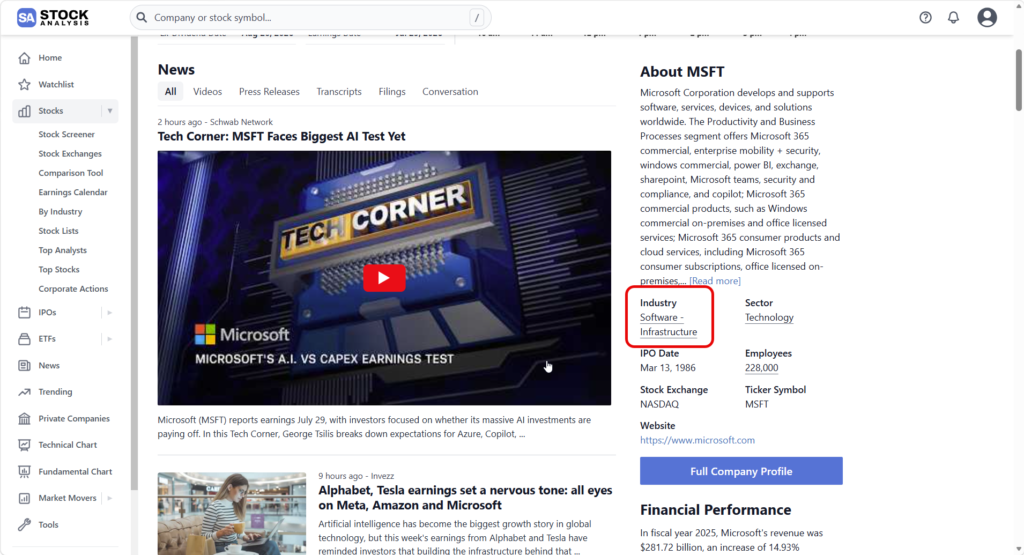
Scroll down to the mid (to lower) right-hand part of the screen and click on industries. Stock Analysis will list all the companies that belong to that industry.
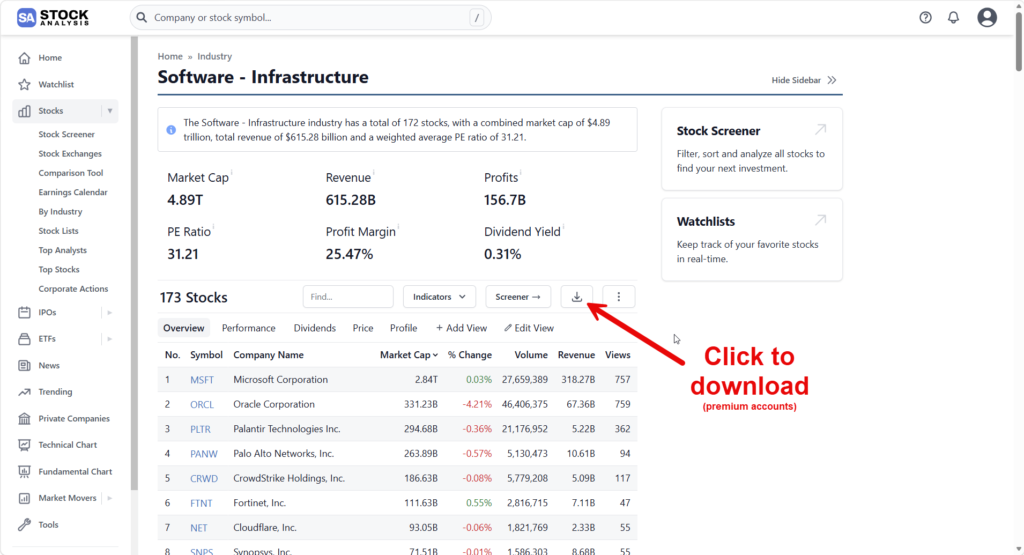
Click on the download button (note: you will need a premium account for this). This will save all the items to your download folder.
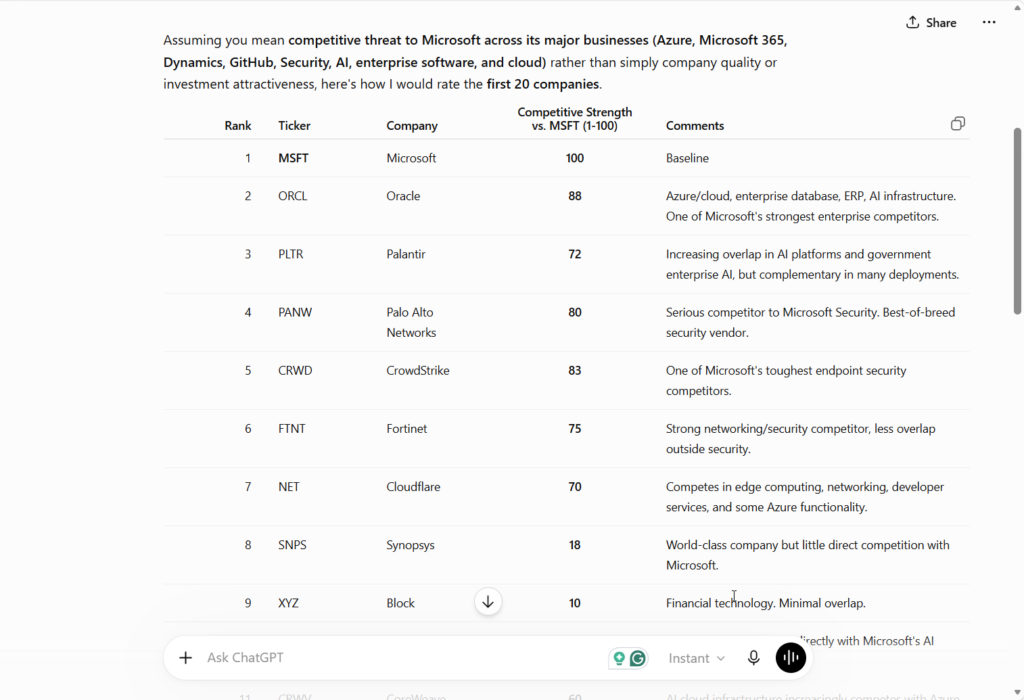
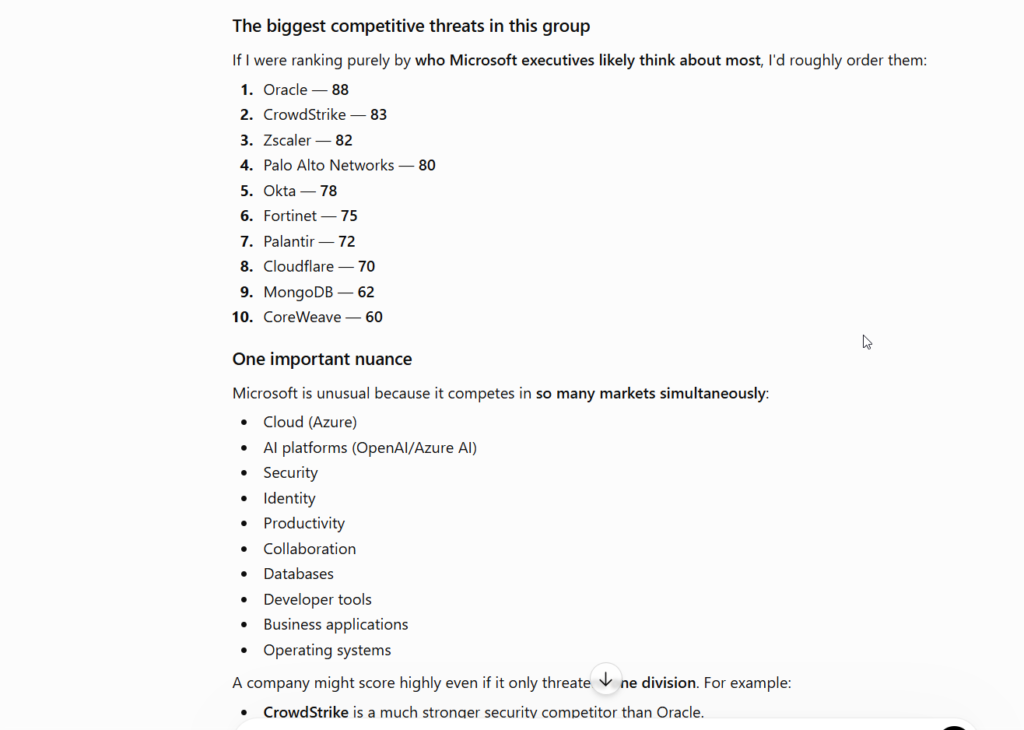
Open up your favorite LLM (ChatGPT, Claude, etc.) and upload the list. Ask the LLM to rate the competitiveness strength of the top 20 (or 30, etc.) companies. Here is the prompt I used:
Please rate the strength of competitors against MSFT for the first 20 or so companies on the list (scale of 1-100)
Note that I did not ask for ChatGPT to summarize the top 10 (I’m glad it did, anyway). So if that’s something you want to have happen and the LLM didn’t do it, follow up with instructions to do so.
As the header of this section stated, this does work but is not perfect. It can be close enough for analysis but just know that it isn’t perfect.
Sign up for Stock Analysis, and you’ll be able to use this technique to get competitor data for your analysis. Use the COUPON CODE: FME for 10% off.
Customize This DCF Tool to Suit Your Valuation Needs
By James Cochrane on July 4, 2026
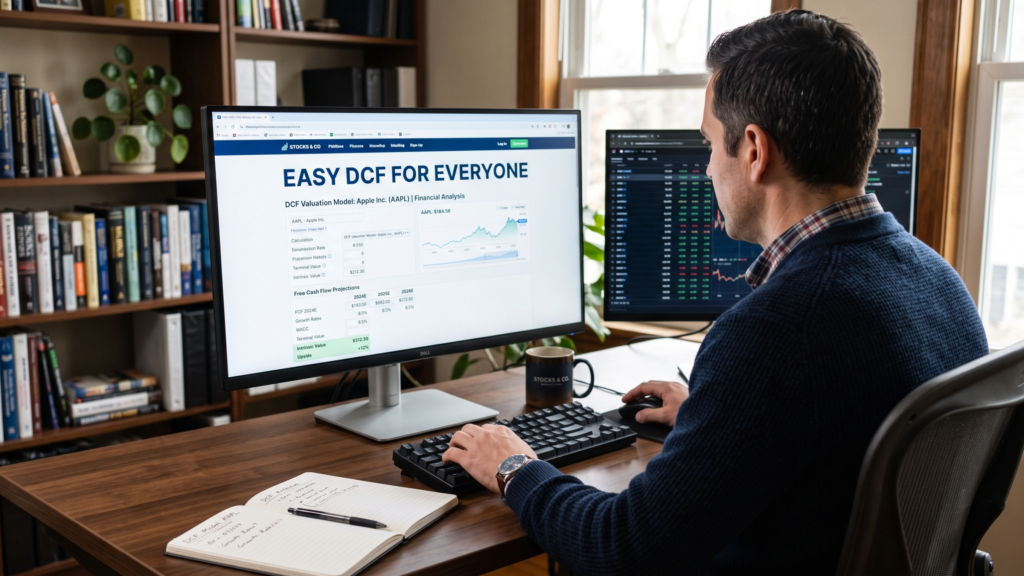
If you’ve ever built a Discounted Cash Flow model in Excel, you already know there are many ways to do it. Some spreadsheets have hundreds of formulas across dozens of tabs. Others pull data from multiple sources and require manual cleanup before you can even begin valuing a company.
That’s why I built this project. I wanted a program that could deliver a quick valuation without spending several days combing through assumptions. Many DCF assumptions can be questionable, especially when the model creator does not explain their reasoning.
The site owner may receive a commission on a purchase made through the links on this page, at no extra cost to you.
Instead of a sophisticated DCF model, I built a solid foundation that is easy to understand and modify. It’s transparent enough that you always know where every number comes from.
If you aren’t a Python coder, don’t let that stop you. You can easily expand it using AI-assisted coding. Whether you use Claude, ChatGPT, Gemini, or another coding assistant, this project gives you a strong baseline to customize to your investing philosophy. Both Claude and ChatGPT can quickly get you set up with the right tools.
Keeping the model simple makes it easier to understand. I don’t want to spend hours bit-fiddling with a bunch of assumptions that are only going to be challenged anyway (which they should be – that’s okay). But I’d rather come up with a defensible model and include upfront disclosures that the model is simple, so the user gets something practical and easy to trust.
Since I am making it publicly available, I also wanted to ensure that it could be easily changed by anyone who wished to do so, so the project remains useful to more people.
This isn’t going to be the final version, either. My goal is to keep expanding it while keeping this initial branch for anyone who wants to start from it, so it stays a useful starting place.
Where the Financial Data Comes From
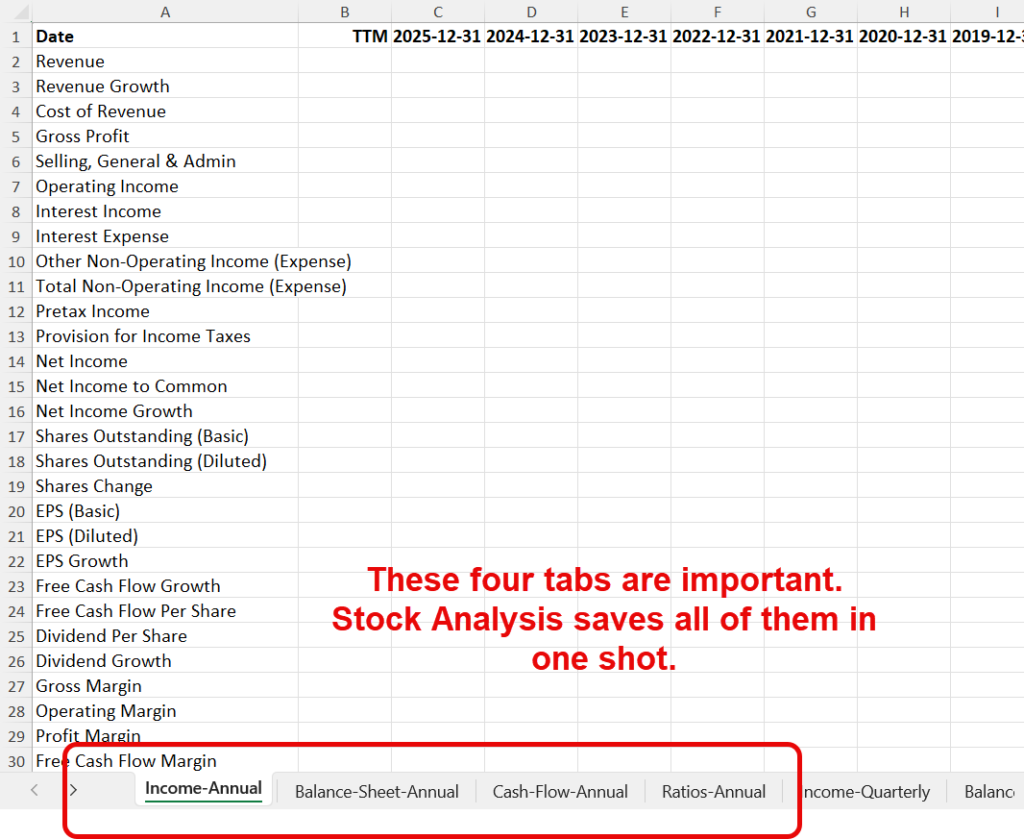
This version of the application was built around Excel exports from Stock Analysis. Because I do not have permission to publish data from Stock Analysis, I have included a template showing what the spreadsheet contains.
For the month of July only, I have gotten Stock Analysis to agree to a free trial and 20% off. Use CHARTS coupon code at checkout. Here is the link:
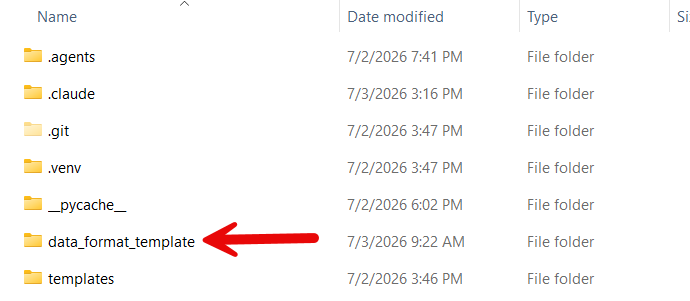
Inside the repository is a folder named data_format_template, which contains an Excel workbook called SA Template.xlsx.
The spreadsheet doesn’t contain any company data. Instead, it contains the worksheet names and column headings the application expects when reading a Stock Analysis export.
I have worked with several data providers over the course of my career. Within the past year, I discovered Stock Analysis. The company provides a lot of data at an affordable price. Furthermore, the type of DCF analysis I use (and model in this program) provides all the data points I need. That is the main reason why the Stock Analysis is the template.
You’ll need a paid version of the service to download data, but the good news is that for July, I have secured a great discount I can pass on to you.
Stock Analysis shows revenue, operating cash flow, capital expenditures, debt, cash, share price, and several other key items, all organized in a clean, consistent format, serving as an efficient starting point for automating the valuation process.
For the month of July only, I have gotten Stock Analysis to agree to a free trial and 20% off. Use CHARTS coupon code at checkout. Here is the link:
If you prefer another provider, AI is especially useful here. Provide your alternative spreadsheet to your coding assistant of choice, along with the included SA Template.xlsx file, and ask it to modify the data loader for the new format. In many cases, that is enough.
Of course, with the price so low (Coupon Code: CHARTS) and a free trial if you sign up during July, you really have nothing to lose.
For the month of July only, I have gotten Stock Analysis to agree to a free trial and 20% off. Use CHARTS coupon code at checkout. Here is the link:
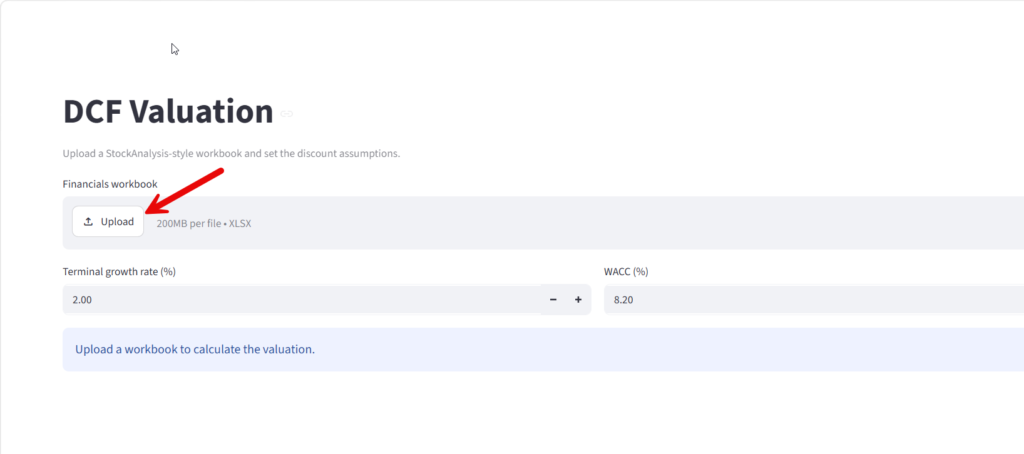
I wanted a model that keeps the number of user inputs to a minimum. You’ll enter two primary assumptions before running the valuation, so the workflow stays fast and focused:
Weighted Average Cost of Capital (WACC)
Terminal Growth Rate
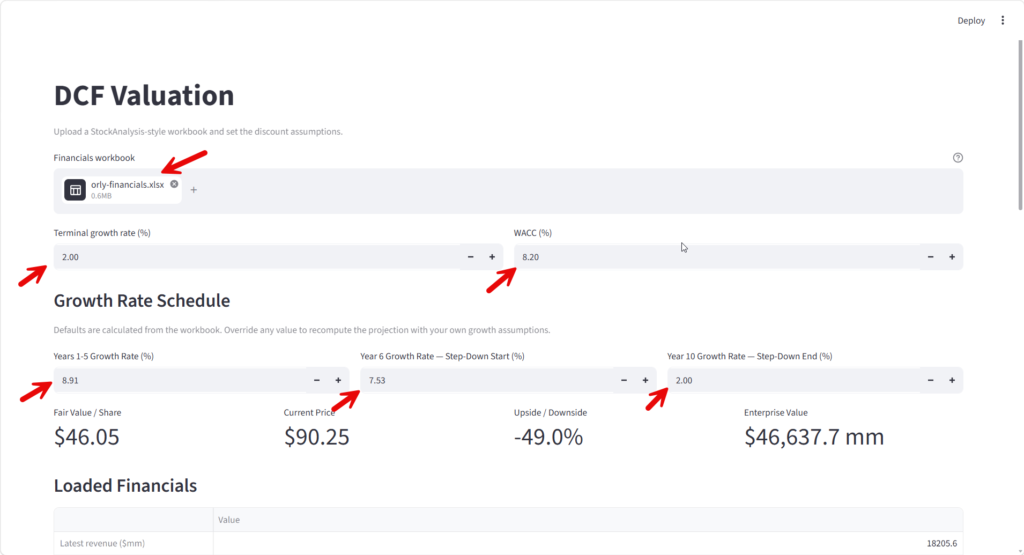
Once your financial statements are loaded, the application calculates the company’s historical five-year revenue CAGR and uses that value to populate the initial growth assumptions. This gives you a starting point before you review or edit anything.
Those growth rates remain fully editable. If you disagree with the calculated values, replace them with your own assumptions. This gives you the convenience of automation while keeping you fully in control of the valuation.
How Revenue Is Projected
Revenue projections begin with the company’s historical five-year compound annual growth rate. By default, that growth rate is applied during Years 1 through 5. Beginning in Year 6, growth gradually declines toward a reduced long-term rate through Year 10. Rather than dropping abruptly from one growth rate to another, the application creates a smooth transition, making the forecast easier to follow.
You can also override these values entirely. To assume the company grows at the same rate for all ten years, enter the same percentage for every growth input. For a steeper slowdown, adjust the Year 6 and Year 10 values. Nothing is locked, so you can tailor the model to your own view.
Free Cash Flow
The model uses one of the most common definitions of Free Cash Flow:
Operating Cash Flow minus Capital Expenditures
The application then calculates the company’s Free Cash Flow Margin by dividing Free Cash Flow by Revenue. That most recent margin is applied to projected revenue throughout the forecast period, keeping the valuation in line with the company’s current cash-generation profile.
This keeps the model straightforward while still tying projected cash generation to expected business growth. Future versions may support changing margins over time, but I wanted the baseline version to stay as easy to understand as possible, so it remains immediately useful.
Discounting Future Cash Flows
Once projected cash flows have been generated, each year’s cash flow is discounted to present value using your selected WACC. This reflects a basic principle in finance: a dollar received ten years from now isn’t worth as much as a dollar received today. Discounting converts future cash flows to present value so they can be summed into a single estimate of enterprise value.
Calculating the Terminal Value
No DCF model can forecast every future year individually. Instead, after the explicit forecast period ends, the application uses the Gordon Growth Model to estimate all remaining future cash flows based on your selected Terminal Growth Rate. That keeps the model practical while still extending value beyond the forecast window.
I tend to favor a conservative terminal growth assumption, since it’s easier to defend over long horizons. That said, there isn’t a universally correct answer; different investors use different assumptions depending on their philosophy and the company they’re analyzing. That’s why the application lets you change it with a single input.
From Enterprise Value to Intrinsic Value
After the discounted cash flows and terminal value are combined, the application adjusts for the company’s balance sheet. Cash is added, and debt is subtracted, producing an estimated equity value. Finally, the application divides that value by the number of shares outstanding to estimate an intrinsic per-share value, providing a usable metric for comparison.
Built to Be Modified
I’ve set this project up so that you can easily make changes manually or with AI. Maybe you’d prefer analyst estimates instead of historical growth, want to project operating margins separately, or add Monte Carlo simulations, scenario analysis, reverse DCF models, or sensitivity tables. Those are all excellent additions, and they make the project even more useful for different investing styles.
With today’s AI coding assistants, you can describe the procedure you want, point the AI at this project, and let it generate much of the code for you. You’ll still want to review and test everything carefully, but AI dramatically lowers the barrier to experimenting with new valuation techniques and tailoring the model to your needs.
Think of this project as a foundation rather than a finished destination, so you can keep turning it into something more useful.
Final Thoughts
Every DCF model is ultimately a structured way of expressing your assumptions about the future. The goal isn’t to discover the one “correct” intrinsic value; it’s to build a model that’s transparent, logically consistent, easy to defend, and genuinely useful for decision-making. Hopefully this project gives you exactly that. If nothing else, it should save you from rebuilding the same spreadsheet over and over again while giving you a flexible starting point you can keep improving as your investing knowledge grows.
The Hidden Cost of ETF Investing: Who Votes When You Don’t?
By James Cochrane on June 25, 2026
ETFs allow you to buy a single fund, which gives you instantly a slice of hundreds, sometimes thousands, of companies. You get diversification, low costs, and almost no maintenance. That convenience is one of the best financial innovations of the last fifty years, and it helps explain why ETFs have come to dominate the market.
But there is a more subtle side to this story, one that rarely comes up at the dinner table or in the financial news. When you invest through an ETF, you typically give up your voting rights in the companies you own. That tradeoff is the hidden cost this piece is about.
At first glance, that doesn’t sound like much of a sacrifice. How much influence could your twenty-five shares of Apple really carry at a shareholder meeting? Probably none. You’d be right to shrug it off.
But here’s the part that doesn’t get talked about enough: when millions of investors shrug it off at the same time, the voting power they’re giving up doesn’t vanish. It gets handed to someone else, adding up to something enormous that changes who has influence. That’s where the real stakes begin.
A Simple Example
Say you own shares in a fund that tracks the S&P 500. In your head, you might think of it simply: I own Microsoft. I own Apple. I own Nvidia. And in an economic sense, you’re right. You share in the gains and the losses. You collect your portion of the dividends. You benefit when the businesses you’ve invested in grow.
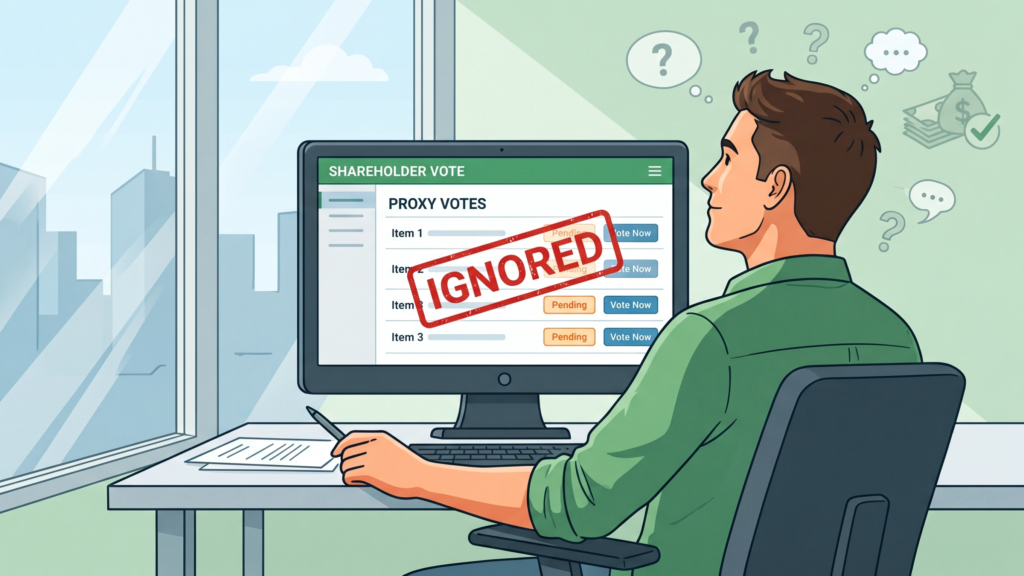
But when one of those companies holds its annual shareholder meeting and puts a vote to the floor, you are almost never the one filling out the ballot. The fund company is. Instead of millions of individual investors casting their own votes, a small number of asset managers vote on their behalf, all at once, as a block.
That distinction sounds technical, but it changes who actually has a say in how some of the world’s largest companies are run, and that is the core issue: ETF investing can separate economic ownership from voting power.
Why Corporate Voting Exists in the First Place
To see why this matters, let’s explore why shareholders get a vote at all.
When you buy stock in a company, you become a partial owner of it. And ownership comes with a voice in how the business is governed. Shareholders are typically asked to weigh in on board of director elections, executive pay packages, major mergers and acquisitions, and various governance proposals.
In theory, this is a system of checks and balances. Management runs the company day-to-day, and shareholders oversee management from a distance, with the power to vote out directors or block decisions they believe are reckless. It is one of the few real levers an owner has if they believe a company is heading in the wrong direction. Strip away the vote, and ownership becomes more passive. You still get the economics, the dividends, and the price appreciation, but you lose the part of ownership that lets you actually push back.
Why This Matters More Than People Tend to Think
Most people pay far more attention to political elections than they ever will to a corporate proxy vote, and that makes sense. Tax policy, regulation, and government spending touch daily life in obvious ways.
But corporate boards make decisions that move trillions of dollars through the economy each year, decisions about hiring, capital spending, acquisitions, product strategy, dividends, buybacks, and how much the CEO gets paid. Those choices ripple out to employees, customers, suppliers, and communities well beyond the shareholders who technically cast the votes.
This isn’t a fringe academic concern, either. It has become an actual fight playing out in real time among the largest fund managers in the country, which is exactly why it’s worth understanding.
How Concentrated the Voting Power Has Actually Become
Here’s where the numbers matter, because the scale of this is genuinely surprising. Harvard Law professor Lucian Bebchuk and Boston University’s Scott Hirst have spent years tracking exactly how much voting power has shifted to the largest index fund managers, BlackRock, Vanguard, and State Street, often called the “Big Three.” Their research found that as of the early 2020s, the Big Three collectively cast a median of roughly 27.6% of the votes at S&P 500 annual meetings, with BlackRock and Vanguard alone each holding close to a tenth or more of the votes at a typical company.
That share is not standing still. The Big Three have nearly quadrupled their collective ownership stake in S&P 500 companies over the past two decades, and each now holds 5% or more of the shares in many public companies. Extrapolating from that trend, the same researchers estimate that the three firms could be casting as much as 40% of the votes at S&P 500 companies within two decades.”
To be clear, holding a quarter or more of the votes at a company doesn’t mean a fund manager controls it outright. Corporate governance is messier than that, and plenty of other shareholders, executives, and board members are part of the picture too. But when one of three firms can swing the outcome of a close vote at thousands of companies simultaneously, the basic question is no longer whether ETFs are convenient. It is who should hold the vote that convenience leaves behind.
Asset Managers Are Starting to Hand Some of the Vote Back
This is the part of the story that’s changing fastest, and it’s worth knowing about if you’re an ETF investor wondering whether you’re stuck with this tradeoff forever. The broader question is whether investors can keep the convenience of ETFs without permanently surrendering the vote.
In the past few years, the major fund managers have rolled out what’s known as pass-through voting, letting individual fund holders choose how their slice of the vote gets cast rather than leaving every decision to the house policy. Vanguard’s version is called Investor Choice, and as of 2026, it covers 32 of its funds, including the flagship 500 Index Fund, reaching roughly 22 million eligible investors and nearly $4 trillion in assets.
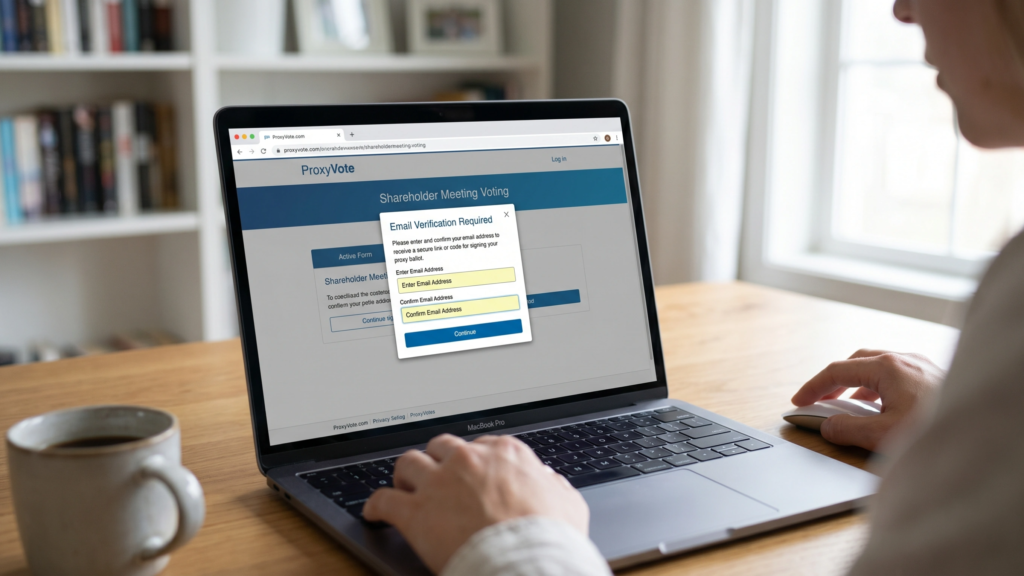
Vanguard has also made it easier to sign up, partnering with Broadridge in 2026 so that investors who hold Vanguard funds through outside brokerages can select a voting policy on ProxyVote.com using just their email address, instead of needing a Vanguard account.
BlackRock runs a similar program called Voting Choice, first launched in 2022. It currently lets eligible clients select from seven third-party proxy voting policies, in addition to BlackRock’s own benchmark guidelines, with the chosen policy applied to a client’s proportional share of the fund. As of early 2026, index equity clients representing roughly $851 billion in assets were actively using the program.
These programs are still far from universal. Plenty of popular ETFs aren’t covered yet, and the sign-up process isn’t always obvious unless you look for it. But the direction is clear: the asset managers that built their businesses on holding your vote for you are now under enough pressure, partly regulatory and partly reputational, that they’re starting to let you take some of it back. If you want to know whether your specific fund offers this, it’s worth checking the fund provider’s website directly, since coverage is expanding on a fund-by-fund basis.
The Collective Action Problem
Even with these new options, most investors still won’t opt in, and that gets at something deeper than just ETF mechanics. It’s a classic collective action problem. Each individual investor correctly figures that their one vote barely matters, so they don’t bother. Multiply that reasoning by tens of millions of people, and you get a predictable result: almost nobody participates directly, and the voting power that was once scattered thinly across the population concentrates in the hands of a few firms by default.
This isn’t unique to ETFs. It’s the same logic behind low turnout in local elections or homeowners’ association votes. What makes the ETF version distinctive is that most investors aren’t even abstaining. They often don’t realize there was a vote to abstain from in the first place.
So What Do the Big Three Actually Do With All That Power?
This is the question that actually matters for deciding whether any of this should bother you. The point is not just who votes, but what ETF investing changes about ownership itself.
The honest answer is that the Big Three have historically been criticized for being too passive, not too aggressive. Bebchuk and Hirst’s research found that, despite their outsized voting power, the Big Three spend strikingly little on stewardship relative to the size of their holdings and, as of a few years ago, had no direct engagement with roughly 90% of their portfolio companies in a given year, on average.
Critics on one side argue that this passivity lets management teams coast without real accountability. Critics on the other side argue the opposite problem: that when the Big Three do engage, their house-voting policies on issues like board diversity and climate disclosure end up imposing one firm’s preferences on thousands of companies and millions of investors who never weighed in.
That tension has shown up directly in how the policies have shifted. Heading into the 2026 proxy season, both BlackRock and Vanguard softened their stances on several fronts, pulling back from personal-characteristic-based diversity considerations in board assessments and moving toward more general, less prescriptive, case-by-case language across multiple governance topics.
Whether you read that as a healthy correction or a worrying retreat probably depends on what you wanted those votes to accomplish in the first place, which is exactly the point. A small number of firms making that call for everyone is the whole issue in miniature, and it shows why the payoff of the debate is so significant.
Should Any of This Stop You From Buying ETFs? The answer depends on whether you think convenience is worth giving up the vote.
No, not really. ETFs remain one of the most useful tools investing has ever produced, and for most people, the benefits of broad, low-cost diversification still outweigh the loss of a direct vote they were unlikely to cast anyway. The point of all this isn’t that ETFs are a bad deal. It’s that every investment choice comes with tradeoffs, and this is one that rarely gets named out loud.
Why Individual Stocks Still Have a Place
Over the last decade or so, some investors have started treating individual stock picking like a relic, something only hobbyists or stubborn traditionalists still bother with. The logic is understandable. Why spend hours researching one company when a single ETF gets you exposure to hundreds?
But owning individual stocks still gives you something an ETF doesn’t: a direct line to the company itself. You get the proxy materials. You can vote on the board. You can evaluate management’s track record and decide for yourself whether they’ve earned your continued support. You’re not just a participant riding the market’s overall direction. You’re the owner of a specific business, with all the rights that come with it.
For people who enjoy digging into a company’s fundamentals and following it over the years, that’s a meaningfully different kind of investing experience, and the voting rights, even if they’re not the headline reason to do it, are a useful reminder that a stock represents a real business and not just a ticker bouncing around on a screen.
A Balanced Approach
Most investors don’t actually need to pick a side here. A lot of people build their portfolio around a core of low-cost ETFs for broad exposure, then hold a smaller number of individual stocks in companies they’ve researched and want to stay closer to. That combination lets you capture the diversification benefits of pooled investing while keeping a direct ownership stake, and a vote, in the businesses you care most about. There’s no universally correct ratio. It depends on how much time you want to spend, how much you enjoy the research, and what you’re trying to get out of your portfolio in the first place.
The Bottom Line
ETF investing has been a genuine net positive for ordinary investors. It has lowered costs, widened access, and allowed millions of people to build diversified portfolios without needing a finance degree. But that convenience comes bundled with a tradeoff most people never examine closely: when you buy the fund, you generally hand off your seat at the table along with it.
The good news is that this is no longer a fixed, take-it-or-leave-it arrangement. The largest fund managers are slowly building ways for you to reclaim a piece of that vote if you want it, and it’s worth at least checking whether your own funds already offer that option. The smaller, more durable lesson is just to know the deal you’re making. Ownership has always been about more than collecting returns. It’s also about having a voice in how the businesses you own are run. And when enough people decide that voice isn’t worth using, somebody else ends up using it for them, whether or not that’s what they would have chosen themselves.
Sources
Bebchuk, Lucian A. and Hirst, Scott. “The Specter of the Giant Three.” Boston University Law Review, 2019.
Bebchuk, Lucian A. and Hirst, Scott. “Big Three Power, and Why It Matters.” Boston University School of Law working paper.
Boston University School of Law. “Should Index Funds Step Up Their Corporate Governance Game?”
Vanguard. “What’s ahead for Vanguard Investor Choice in 2026?” and “A new way to participate in Vanguard Investor Choice.”
BlackRock. “Empowering investors through Voting Choice.”
Cooley LLP. “Key Updates in BlackRock’s and Vanguard’s 2026 US Proxy Voting Guidelines.”
Gold vs Gold Miners: Why These Are Two Completely Different Investments
By James Cochrane on June 24, 2026
When someone says, “I’m thinking about investing in gold,” the first thing to ask is:
What do you actually mean by gold? That might sound like a strange question. After all, gold is gold, right?
Not exactly.
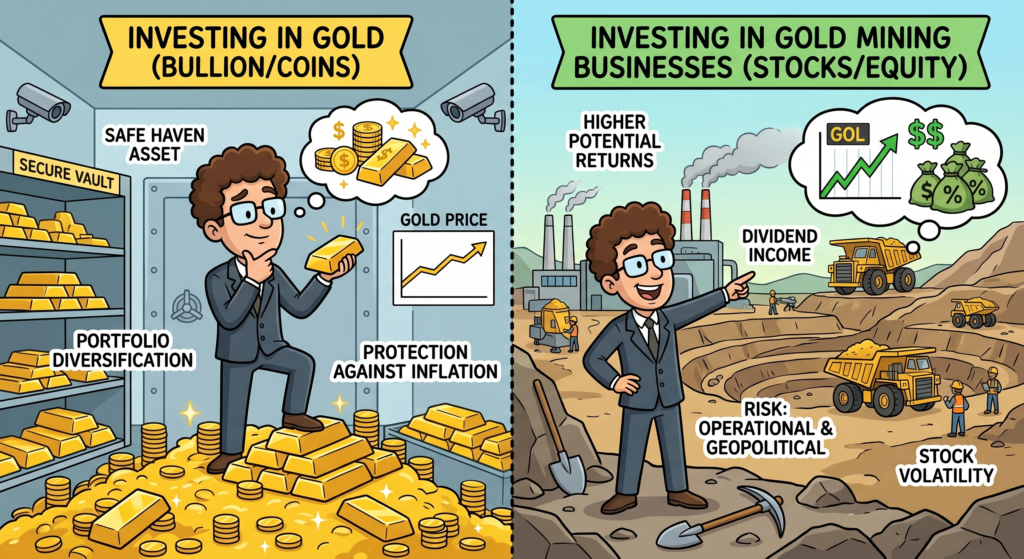
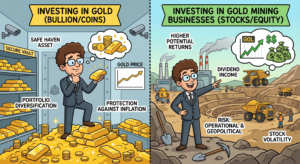
Some investors buy physical gold coins and bars. Others buy exchange-traded funds that track gold prices. Still others buy shares of companies that mine gold. While all three are connected to the precious metals market, they behave very differently.
In fact, many investors who think they own a “gold investment” are often surprised when it doesn’t perform the way they expected. Knowing the difference can help you avoid disappointment and, more importantly, pick the kind of investment that fits your goals.
There is also another lesson hidden beneath the surface here, one that applies not just to gold, but to every investment decision you make.
We’ll return to that idea soon.
The First Question: What Job Are You Hiring Gold To Do?
Before we talk about gold itself, let’s think about purpose.
If you are hiring an employee, you wouldn’t hire a carpenter to do accounting. Nor would you hire an accountant to build a house. Both might be great at their jobs, but they have different roles. It’s the same with investments. One of the biggest mistakes investors make is buying something without first deciding what they want it to do in their portfolio. When investors say they want exposure to gold, they are usually trying to accomplish one of several things:
Hedge against inflation
Protect wealth during uncertainty.
Diversify a portfolio
Speculate on rising gold prices.
Generate long-term capital appreciation.
Seek leverage from rising metal prices.
The issue is that different types of precious metals investments are better at different things.
Investing in Gold Itself
When most people think of gold, they imagine coins, bars, or maybe an ETF that follows the price of gold. These investments are tied directly to the underlying metal.
If gold goes up by 10%, your gold holdings should usually rise by about the same amount, minus any expenses or small tracking differences. The idea behind this kind of investment is pretty simple:
If demand for gold increases or investors seek safety, the price of gold may rise.
Gold itself does not produce earnings or manufacture products and, by itself, does not generate cash flow. Gold is often viewed as a store of value rather than a productive asset.
Why Investors Buy Gold
Investors commonly purchase gold because they believe:
Inflation may erode purchasing power.
Currency values may weaken.
Financial markets may become unstable.
Governments may increase debt levels.
Geopolitical risks may increase.
Here’s something important to notice. None of those reasons requires having a business. People who buy gold are usually more focused on protection than on growth.
Investing in Gold Mining Companies
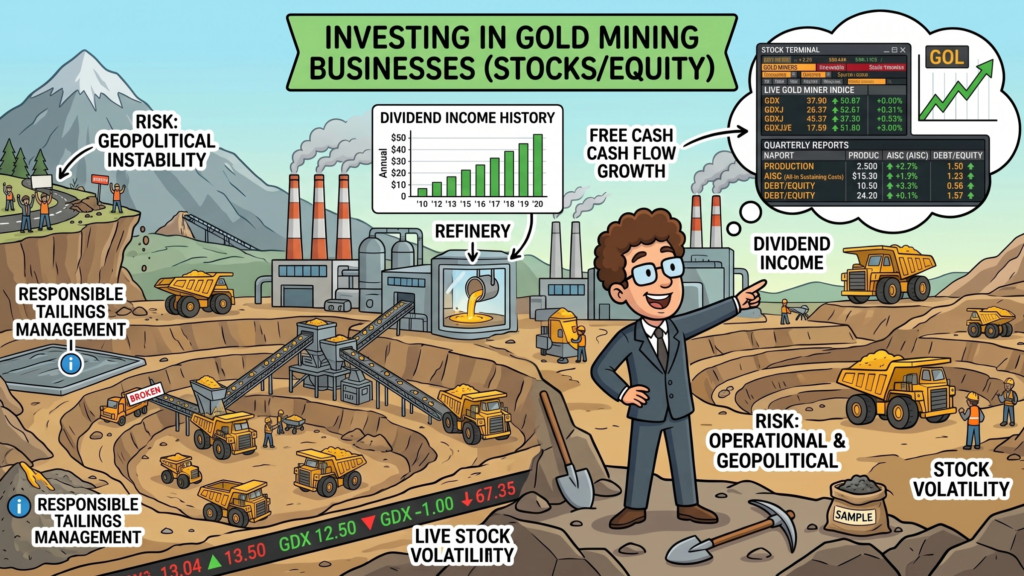
Now let’s look at gold miners instead. A gold mining company is not gold; it’s a business, and it is crucial to understand the difference. When you buy a mining company, you are purchasing a stake in an operating enterprise that:
Hires employees
Purchases equipment
Manages costs
Acquires land
Explores for new deposits
Raises capital
Makes strategic decisions
The price of gold is very important to miners, but it’s just one of many things that affect how well they do.
A Simple Example
Suppose gold rises from $2,500 per ounce to $3,000 per ounce. At first glance, you might assume a gold miner would rise by the same amount. But miners often experience boosted results.
Imagine a miner produces gold at a cost of $2,000 per ounce.
At $2,500 gold:
Revenue per ounce: $2,500
Cost per ounce: $2,000
Profit per ounce: $500
Now gold rises to $3,000.
Revenue per ounce: $3,000
Cost per ounce: $2,000
Profit per ounce: $1,000
Gold increased 20%.
Profit increased 100%.
That operating leverage is one reason mining stocks can sometimes dramatically outperform the metal itself. But there is another side to that equation.
The Risk Side
Suppose gold falls, or energy costs rise. Alternatively, mines can experience production issues. The business can make bad decisions,, or the government can regulate mining in ways that hurt business performance.
Now the mining company might struggle even if gold prices stay about the same. Unlike gold itself, mining companies carry business risk. Investors sometimes forget this because they only focus on the price of gold.
Why Gold Miners Can Underperform Gold
Many investors are surprised when gold reaches new highs while mining stocks lag behind. This happens more often than people realize. A mining company’s stock price depends on factors such as:
Production growth
Reserve quality
Management decisions
Debt levels
Political risk
Labor costs
Fuel costs
Environmental compliance
Capital allocation
Gold itself can be doing what is expected, while the mining company is having a tough time.
Here’s another way to look at it. Buying gold is making a statement about gold. But buying a mining company is making a statement about management’s ability to run a profitable business that happens to produce gold.
These are two different ideas.
Which Type of Investor Prefers Gold?
Many investors who favor physical gold or gold-backed funds tend to value:
Capital preservation
Portfolio diversification
Lower operational risk
Simplicity
They often see gold as a kind of insurance. Nobody buys homeowners’ insurance hoping their house burns down. Likewise, many gold investors are not necessarily hoping for financial turmoil.
They just want protection in case something does happen.
Which Type of Investor Prefers Gold Miners?
Mining investors often have a different mindset. They are likely seeking higher growth potential and greater upside leverage. Furthermore, they seek income through dividends. The ideal situation is to discover more mining hot spots, which can help the company outperform the metal itself.
These investors are usually more comfortable looking at businesses and their numbers. They may review financial statements, production reports, reserve estimates, and management quality. Their investing thesis is not merely that gold will rise. They want to know if the business will create shareholder value.
The Hidden Question Most Investors Miss
Which one is better for me?
This is where a lot of investors get stuck. They spend countless hours researching investments without first understanding their own investing tendencies.
Some investors genuinely sleep better knowing they own stable, diversified holdings. Others enjoy researching companies and accepting more risk in exchange for potentially higher returns.
Neither approach is inherently right or wrong.
The real mistake is choosing a strategy that doesn’t align with your personality and investor profile. An aggressive growth investor may become frustrated holding conservative assets, while a conservative investor may become anxious about owning highly volatile mining stocks. The mismatch is often what causes problems.
The Precious Metals Lesson Applies Everywhere
The difference between gold and gold miners is really a lesson about investing in general. The same concept appears in countless areas:
Bonds versus dividend stocks
Index funds versus individual stocks
Large companies versus small companies
Real estate versus REITs
Growth investing versus value investing
Every investment carries an underlying assumption. And every investor carries an underlying personality. The more those two things align, the more likely you are to stick to your plan during tough times, which helps you stay committed.
Final Thoughts
Gold and gold miners might look similar at first, but they are actually very different investments. Gold itself is often used as a store of value, a hedge, or a diversification tool. Gold miners are operating businesses whose fortunes depend on both gold prices and management execution.
Neither is automatically better than the other, and each serves a different purpose. The real challenge is determining which purpose aligns with your goals and risk tolerance.
It’s interesting that most investors spend years learning about investments, but hardly any time learning about themselves. Maybe it should be the other way around.
If you’ve ever wondered why some investments feel comfortable, and others keep you up at night, there’s probably a reason for that. Before you make your next investment decision, it might help to find out if your natural investing habits are affecting your choices more than you think.
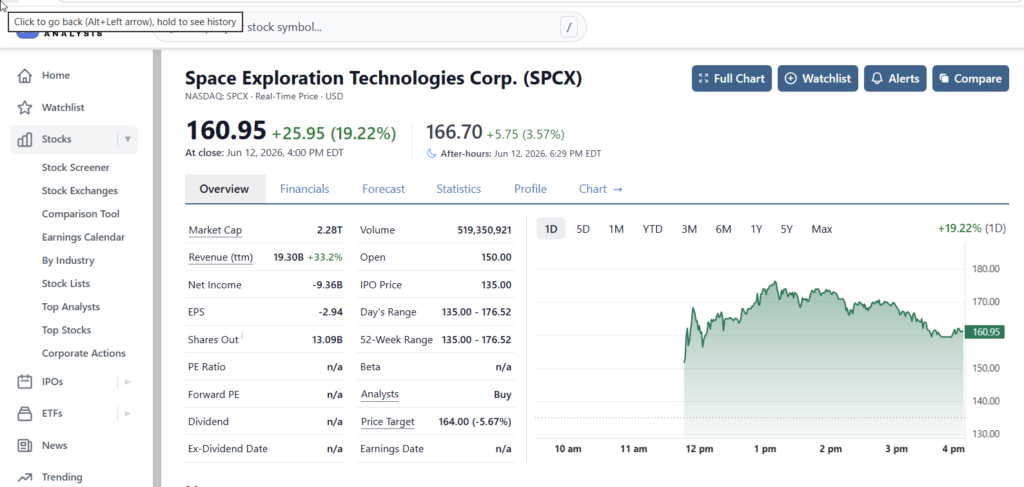
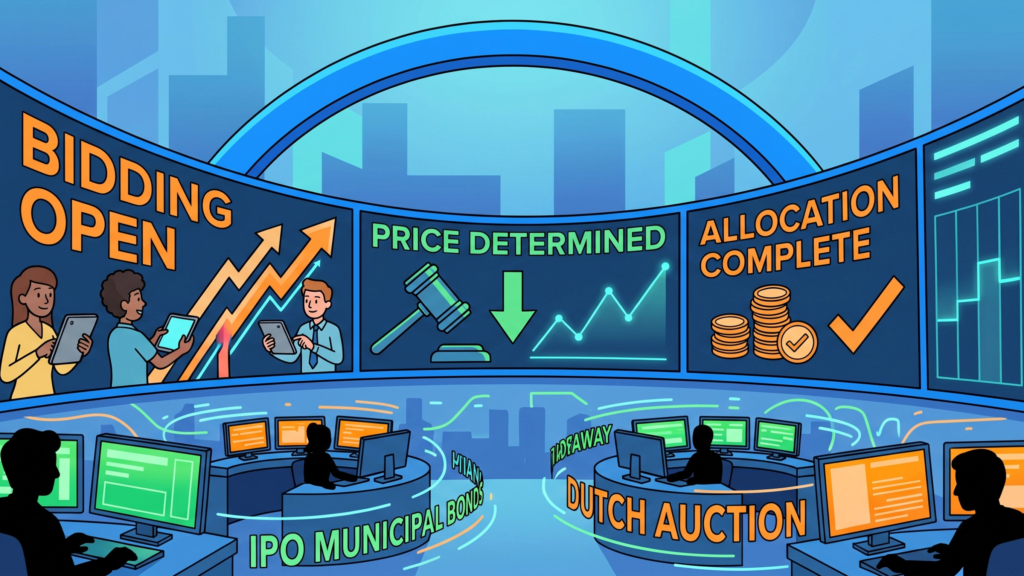
With all the hype surrounding the SpaceX IPO, individual investors can be forgiven for experiencing FOMO (fear of missing out). But will you actually benefit from any purchase you make during an IPO?
The allure is understandable. After all, the media keeps telling us that $SPCX made Elon Musk the first trillionaire. And many insiders became multi-millionaires, if not billionaires.
Before you close out all your bank accounts to buy $SPCX, you should consider what the most famed investor, Warren Buffett, and his mentor, Benjamin Graham, had to say on the topic.
What Warren Says…
Warren Buffett’s net worth has been built via his long-term holdings. He wasn’t a fan of IPOs, and this is what he said about them:
“It’s almost a mathematical impossibility to imagine that, out of the thousands of things for sale on a given day, the most attractively priced is the one being sold by a knowledgeable seller to a less-than-fully-informed buyer.”
Buffett supposedly never purchased shares of an IPO. He allows companies to build a strong track record in the market before he’ll even consider them. Often, the time horizon can be more than a year away.
It’s rare for an IPO to offer anything other than inflated prices. Buffett is a value investor, and there is no value in stocks priced above intrinsic value. It’s also difficult to determine the intrinsic value of an IPO, since it has no history as a publicly traded company.
Benjamin Graham, who was Buffett’s mentor, had an even stronger dislike for IPOs. Graham observed that IPOs often occurred during the giddy days of bull markets, when everyone was in a buying mood. This mindset, of course, drives prices higher extensively.
Graham also noted that the history of new issues follows a treacherous pattern for most investors. Early investors, i.e., institutions, venture capitalists, and insiders, capture the bulk of the gains. The individual investors are left holding the bag at the top of the market.
He is also known to say that the more euphoric the marketing hype, the more skeptical individual investors should be. Investment banks get paid big bucks to hype the IPOs like they are the second coming.
What the Data Shows
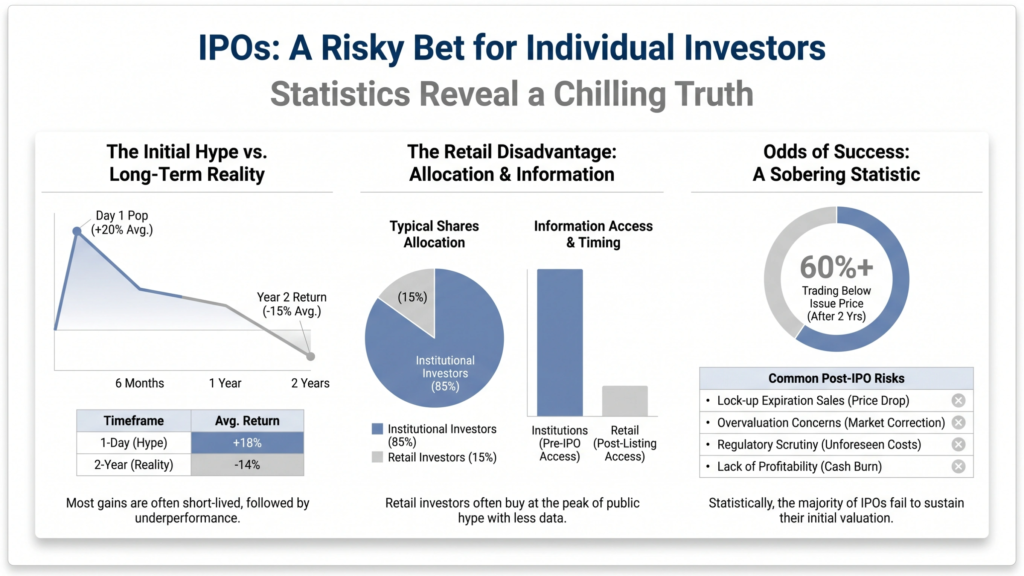
Empirical evidence largely supports Buffett and Graham’s instincts. Studies have consistently found that IPOs, as a class of investment, tend to underperform the broader market over the medium and long term. The short-term “IPO pop” on the first day of trading often reflects institutional investors locking in quick profits, not the creation of lasting value for ordinary shareholders.
A famous study by Jay Ritter, a finance professor who has tracked IPO performance for decades, found that companies going public have historically underperformed comparable non-IPO stocks over the three to five years following their offering. The excitement of opening day rarely translates into durable outperformance.
A more recent study by Ritter covering IPOs from 1980 to 2019 confirms that pattern repeats in two-thirds of IPOs tracked. These IPOs trail the market by over 10% for over three years after going public in many cases.
Some IPOs have been successful and have done well for all investors right out of the gate. But there are no indicators that can identify these in advance. Since the odds are against successful IPOs for individual investors, most may want to lean on those odds and skip IPOs altogether.
What Can Be Done?
IPOs have a lockup period, which prevents investors from buying and, soon after, selling their shares when the price advances due to hype. When the lockup period expires, IPO IPO shares often go into a tailspin. It’s difficult for individual investors ot play fast-moving situations like the post-lockup selloff.
Many investors keep the IPO on their watch list and sometimes even wait a few quarters to see how Wall Street reacts to events related to the IPO. Remember that investing is supposed to be for the long term. If the company is a dud, you’ll know that when the dust settles.
You likely would not have received the number of shares you requested. Therefore, the opportunities you think you will lose because you only received a few shares won’t be as impactful.
Another option is to consider that many other companies in the market have established histories. While FOMO on IPOs may cloud your judgment momentarily, keep in mind that you are in the driver’s seat when it comes to picking out companies to buy. IPOs are not the only means to make money in the stock market.
Investor Profile Quiz
Disclaimer:
This quiz is for educational purposes only and does not constitute financial, investment, or tax advice. Results are general in nature and are not a substitute for advice from a qualified financial professional. No answers or results are recorded or stored - everything is calculated in your browser.
Disclaimer:
This result is for educational purposes only and does not constitute financial, investment, or tax advice. Please consult a qualified financial professional before making investment decisions.
By the Time You Hear About the IPO, the Money Is Already Made
By James Cochrane on June 12, 2026
A company you’ve been following for a while finally goes public. The financial press covers it breathlessly, and your investment platform sends you a notification. CNBC runs a ticker across the bottom of the screen with a first-day gain of 30, 40, or sometimes 80 percent.
And you think: I should have gotten in on that.
What is actually more likely is that you wouldn’t have been able to.
Site owner may receive commissions from purchases made from links on this page.
The IPO You Think You’re Buying Isn’t the IPO That Made the Headlines
When you hear that a stock “popped 40% on its first day of trading,” that 40% is measured from the offering price. It’s the price at which shares were sold before public trading began. By the time you opened your brokerage app that morning, you were already buying into a market that had processed much of that gain.
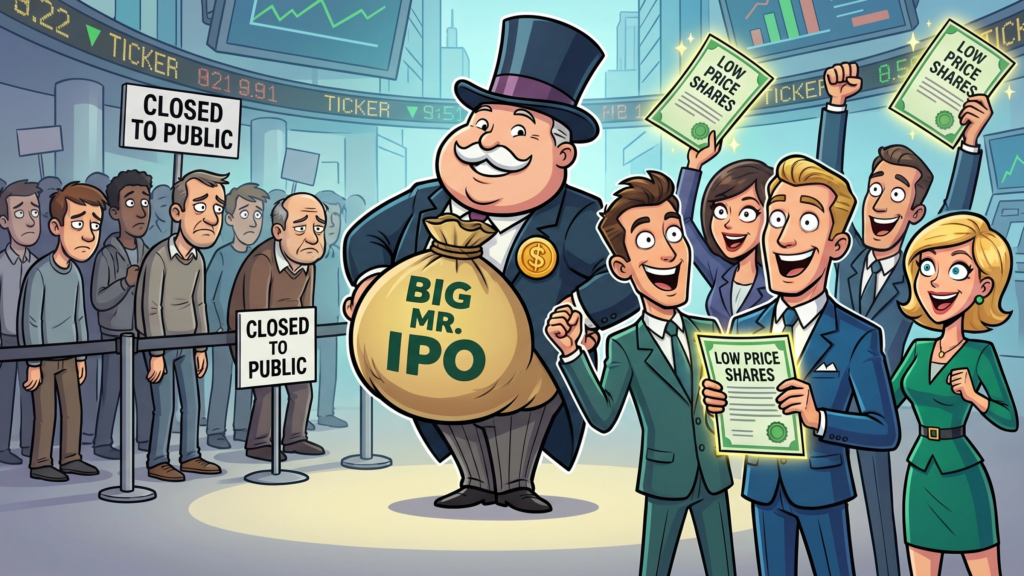
The people who captured that 40%? They weren’t you. They were large institutional investors, pension funds, hedge funds, and mutual fund giants who received share allocations directly from the underwriting banks before a single share traded publicly. They got in on the ground floor. You came late to the party, and it’s not your fault. That’s the way the process works.
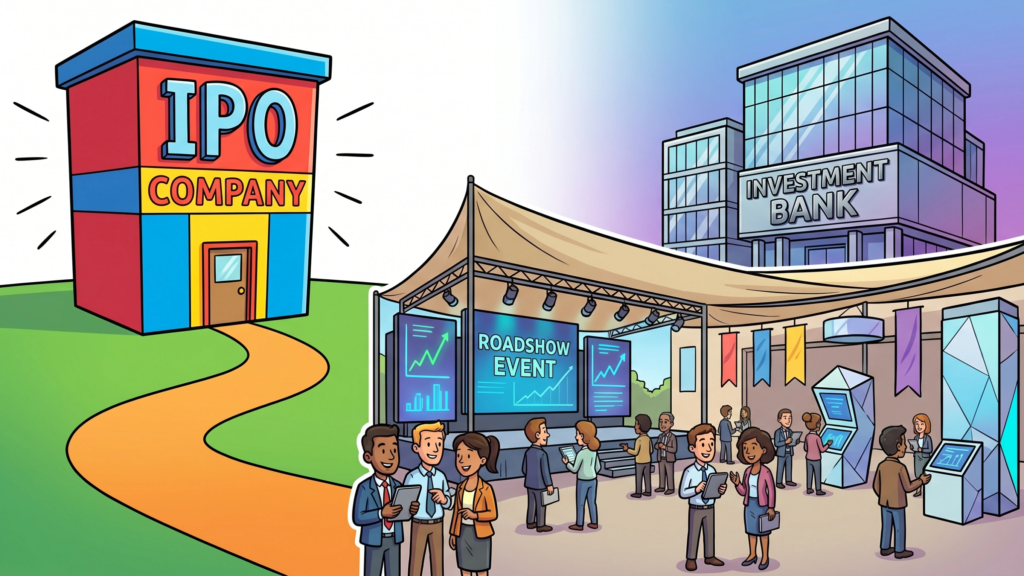
When a private company decides to go public, it hires investment banks to manage the offering. These underwriters run what’s called a roadshow, a series of presentations to major institutional investors to gauge demand and build an order book. The feedback from those meetings shapes the final offering price.
The people in the room during those discussions have an edge you are not privy to. You’re relying on a prospectus filed with the SEC, the same document available to everyone, stripped of the richer context that comes from sitting across the table from the CEO and CFO and hearing how they talk about the business.
Once the price is set, shares are allocated. And here’s where the favoritism becomes most visible: institutions with longstanding relationships with the underwriting banks receive the lion’s share of allocations. Retail investors, individual people like you, receive smaller portions, or nothing at all.
The result is that access to the IPO price itself has become one of the most valuable privileges in today’s markets. And that privilege is not distributed equally.
Why Stocks Are Intentionally Priced Below What the Market Will Pay
You might wonder: if institutional investors are going to push the price up 40% on day one, why didn’t the company just price the IPO 40% higher and raise more money?
The answer reveals something important about how incentives are structured. Academic research dating back decades has documented that IPOs are systematically underpriced, meaning companies consistently leave money on the table at the offering stage. This isn’t carelessness. It’s deliberate.
By pricing below the level at which the market would clear, underwriters essentially reward institutional investors for participating honestly in the book-building process and for supporting future offerings. The first-day pop is, in a sense, compensation for being a reliable partner.
For you, as someone who can’t participate in book-building, this translates to a consistent disadvantage. The price you pay when you buy a newly public stock in the open market already reflects the excitement that institutional investors captured at a lower price. You’re absorbing risk that they’ve already partially been compensated for.
Remember Facebook?
In 2012, Facebook went public in one of the most hyped IPOs in a generation. You almost certainly recognize the buzz. Millions of retail investors wanted in.
What many of them got served as a lesson in valuation. The offering price was set aggressively high, technical problems plagued the Nasdaq opening, and the stock spent the better part of the next year trading below the IPO price. Meanwhile, reporting later revealed that certain institutional investors had received additional information during the roadshow about weakening income trends, context that wasn’t as clearly visible to the general public at the time.
The company recovered, of course, and became one of the most valuable on earth. But if you bought Facebook shares in the days after the IPO at the elevated opening prices, you waited years to break even.
The lesson isn’t that Facebook was a bad company. It’s that buying into public enthusiasm at IPO time without institutional tools puts you in a fundamentally different position from the investors who shaped the offering.
Could the System Be Different?
There are alternatives. Google famously tried a Dutch auction structure for its 2004 IPO, allowing any investor to submit bids directly. The goal was to reduce underpricing and favoritism by allowing the market to set prices more democratically. It worked reasonably well and gave retail investors a more meaningful opportunity to participate at the offering price.
Almost no company has followed Google’s lead in the two decades since.
More recent listings, where existing shareholders sell directly into the market without underwriter allocations, have attracted attention. Spotify and Palantir went this route, and the structure does reduce the allocation favoritism inherent in traditional IPOs. However, direct listings work best for well-known companies that don’t need to raise new capital, which limits how broadly the model can be applied.
Proposals exist to require companies to reserve a fixed percentage of IPO shares for retail investors, or to mandate greater transparency in allocation decisions. These are reasonable ideas. They’ve gained little traction.
What This Means for You
None of this means you should ignore IPOs entirely. It means you should approach them with clear eyes about what you’re actually buying.
When you buy shares of a newly public company in the open market, you’re not buying at the IPO price. You’re buying at whatever the market has already decided those shares are worth after institutional investors have done their work. That can still be a good investment. Companies grow after their IPOs, sometimes spectacularly. But the specific advantage of the IPO price itself, and the first-day gains it can generate, is largely not available to you.
The financial media’s celebration of IPO “pops” is really a celebration of a return that accrued to someone else. By the time you’re watching the ticker, the best of it is already in someone else’s pocket.
Understanding that isn’t pessimistic. It’s just honest, and honesty is the only reliable starting point for making good decisions with your money.
📘 IPO Investing FAQ
1. What is an IPO?
An Initial Public Offering (IPO) is the process by which a private company sells shares to the public for the first time. It allows the company to raise capital and gives investors the opportunity to buy ownership in the business.
2. Why do IPO prices often “pop” on the first day?
Because IPOs are frequently underpriced — intentionally. Academic research shows that IPOs are typically priced below the market’s willingness to pay. This creates a first‑day gain that rewards institutional investors who received shares at the offering price.
3. Why don’t retail investors get IPO shares at the offering price?
Because allocations are controlled by underwriting banks, which prioritize:
large institutions
long‑standing clients
investors who participate in many deals
Retail investors usually receive small allocations or none at all, meaning they buy only after the price has already jumped.
4. What is the book‑building process?
Book‑building is the system underwriters use to gauge demand for an IPO. They meet with institutional investors, collect bids, and use that information to set the final offering price.
Institutions get access to management and real‑time demand data. Retail investors do not.
5. Why are IPOs underpriced on purpose?
Underpricing:
encourages institutions to provide honest demand feedback
reduces the risk of a failed offering
rewards investors who support future deals
strengthens relationships between banks and institutions
This is how the system works.
6. Is buying an IPO in the open market a bad idea?
Not necessarily. Buying after the IPO pop simply means you’re not capturing the allocation premium.
A newly public company can still be a great long‑term investment, but you’re not getting the same deal institutions get.
7. What happened with Facebook’s IPO?
Facebook’s 2012 IPO is a classic example of:
aggressive pricing
technical failures
selective disclosure to institutions
retail investors buying at inflated prices
The stock eventually became a massive success, but early retail buyers waited years to break even.
8. What is a Dutch auction IPO?
A Dutch auction allows investors, including retail investors, to submit bids directly. The final price is set where supply meets demand.
Google used this method in 2004. It worked, but very few companies have adopted it since.
9. What is a direct listing?
A direct listing allows existing shareholders to sell shares directly to the public without underwriter allocations.
Benefits:
more transparent pricing
fewer favoritism issues
Drawbacks:
no price stabilization
best suited for well‑known companies that don’t need to raise capital
Spotify and Palantir used this method.
10. Are there reforms that could make IPOs fairer?
Yes. Common proposals include:
guaranteed retail allocations
transparency in allocation decisions
hybrid or Dutch auction models
These ideas have support but limited adoption.
11. Should retail investors avoid IPOs entirely?
No — but they should understand what they’re buying.
When you buy a newly public stock:
You’re not buying at the IPO price
You’re buying after institutions have already captured the underpricing premium
IPO investing can still be profitable — just not in the way financial media often implies.
12. Why does financial media hype IPO pops?
Because “Stock jumps 40% on first day!” is exciting.
But that 40% gain went to someone else, not to the retail investor reading the headline.
13. What’s the biggest misconception about IPOs?
That retail investors can “get in early.”
In reality, retail investors almost always arrive after institutions have captured the early gains.
14. What’s the smartest way for retail investors to approach IPOs?
With clarity:
Evaluate the company, not the hype
Ignore first‑day pops
Treat IPOs like any other investment
Focus on long‑term fundamentals
The IPO price is a privilege, not a right, and it’s rarely available to retail investors.
Sources & Suggested References
These are authoritative, academically recognized sources that support the article’s claims:
Academic Research
Ritter, Jay. “The Long‑Run Performance of Initial Public Offerings.” Journal of Finance (1991).
Loughran, Tim & Ritter, Jay. “Why Don’t Issuers Get Upset About Leaving Money on the Table?” Review of Financial Studies (2002).
Ibbotson, Roger. “Price Performance of Common Stock New Issues.” Journal of Financial Economics (1975).
Regulatory & Industry
SEC: Investor Bulletin — Investing in an IPO
FINRA: Understanding IPO Allocations
Case Studies
Reuters (2012): Selective disclosure during Facebook IPO
Wall Street Journal (2012): Facebook IPO pricing and technical failures
Did You Know That You Can Track Market Sectors with ETFs?
By James Cochrane on June 7, 2026
Investors often look to the S&P 500 as a guide to market performance. But the S&P includes 500 stocks that meet certain criteria set by an index committee.
Site owner may receive a commission from sales generated from the links on this page.
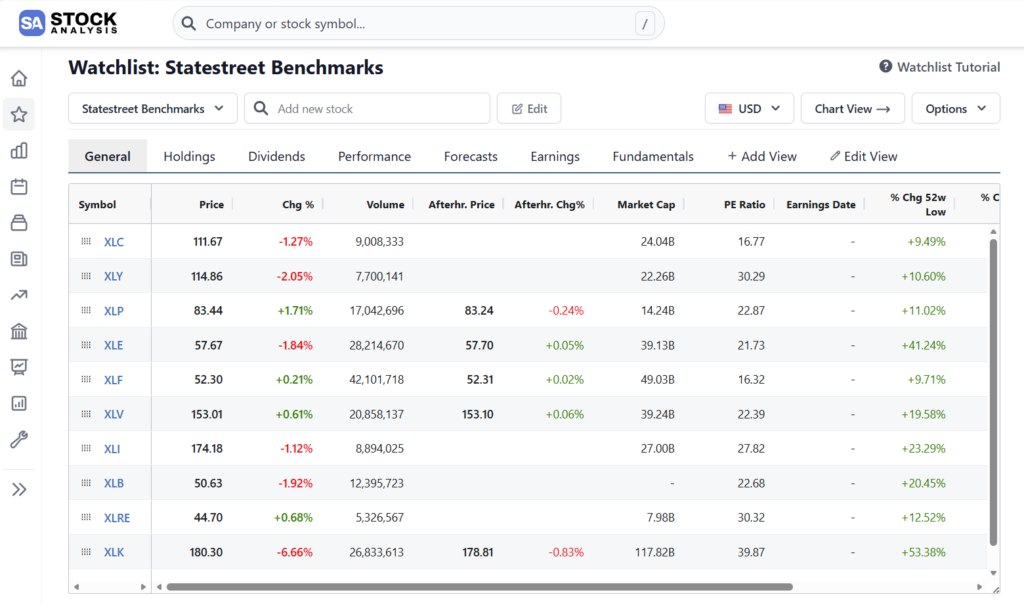
That said, it is a useful indicator and probably one of the best to determine how the overall stock market is doing. But it’s not the complete picture. Statestreet has a series of indicators that track several important sectors.
NOTE: You will need to define your own watchlist. But that is not difficult. Here is a quick tutorial on the steps.
State Street Communication Services Select Sector SPDR ETF ($XLC)
The State Street Communication Services Select Sector SPDR ETF ($XLC) is an exchange-traded fund that mostly invests in communication services equities. The fund tracks a market-cap-weighted index of US telecommunication and media & entertainment components of the S&P 500 index. XLC was launched on Jun 18, 2018, and is issued by State Street.
State Street Consumer Discretionary Select Sector SPDR ETF ($XLY)
The State Street Consumer Discretionary Select Sector SPDR ETF ($XLY) is an exchange-traded fund that mostly invests in consumer discretionary equity. The fund tracks a market-cap-weighted index of consumer-discretionary stocks drawn from the S&P 500. XLY was launched on Dec 16, 1998, and is issued by State Street.
State Street Consumer Staples Select Sector SPDR ETF ($XLP)
The State Street Consumer Staples Select Sector SPDR ETF ($XLP) is an exchange-traded fund that is based on the S&P Consumer Staples Select Sector index, a market-cap-weighted index of consumer-staples stocks drawn from the S&P 500. XLP was launched on Dec 16, 1998 and is issued by State Street.
The State Street Energy Select Sector SPDR ETF ($XLE) is an exchange-traded fund that is based on the S&P Energy Select Sector index, a market-cap-weighted index of US energy companies in the S&P 500. XLE was launched on Dec 16, 1998 and is issued by State Street.
State Street Financial Select Sector SPDR ETF ($XLF)
The State Street Health Care Select Sector SPDR ETF ($XLV) is an exchange-traded fund that is based on the S&P Health Care Select Sector index. The fund tracks health care stocks from within the S&P 500 Index, weighted by market cap. XLV was launched on Dec 16, 1998 and is issued by State Street.
State Street Health Care Select Sector SPDR ETF ($XLV)
The State Street Health Care Select Sector SPDR ETF ($XLV) is an exchange-traded fund that is based on the S&P Health Care Select Sector index. The fund tracks health care stocks from within the S&P 500 Index, weighted by market cap. XLV was launched on Dec 16, 1998 and is issued by State Street.
State Street Industrial Select Sector SPDR ETF ($XLI)
The State Street Industrial Select Sector SPDR ETF ($XLI) is an exchange-traded fund that is based on the S&P Industrial Select Sector index. The fund tracks a market cap-weighted index of industrial-sector stocks drawn from the S&P 500. XLI was launched on Dec 16, 1998 and is issued by State Street.
State Street Materials Select Sector SPDR ETF ($XLB)
The State Street Materials Select Sector SPDR ETF ($XLB) is an exchange-traded fund that is based on the S&P Materials Select Sector index, a market-cap-weighted index of US basic materials companies XLB was launched on Dec 16, 1998 and is issued by State Street.
State Street Real Estate Select Sector SPDR ETF ($XLRE)
The State Street Real Estate Select Sector SPDR ETF ($XLRE) is an exchange-traded fund that is based on the S&P Real Estate Select Sector index, a market-cap-weighted index of REITs and real estate stocks, excluding mortgage REITs, from the S&P 500. XLRE was launched on Oct 7, 2015 and is issued by State Street.
State Street Technology Select Sector SPDR ETF ($XLK)
The State Street Technology Select Sector SPDR ETF ($XLK) is an exchange-traded fund that is based on the S&P Technology Select Sector index. The fund tracks an index of S&P 500 technology stocks. XLK was launched on Dec 16, 1998 and is issued by State Street.
State Street Utilities Select Sector SPDR ETF ($XLU)
The State Street Utilities Select Sector SPDR ETF ($XLU) is an exchange-traded fund that is based on the S&P Utilities Select Sector index, a market-cap-weighted index of US utilities stocks drawn exclusively from the S&P 500. XLU was launched on Dec 16, 1998 and is issued by State Street.
Click on the image to enlarge the page, or click here.
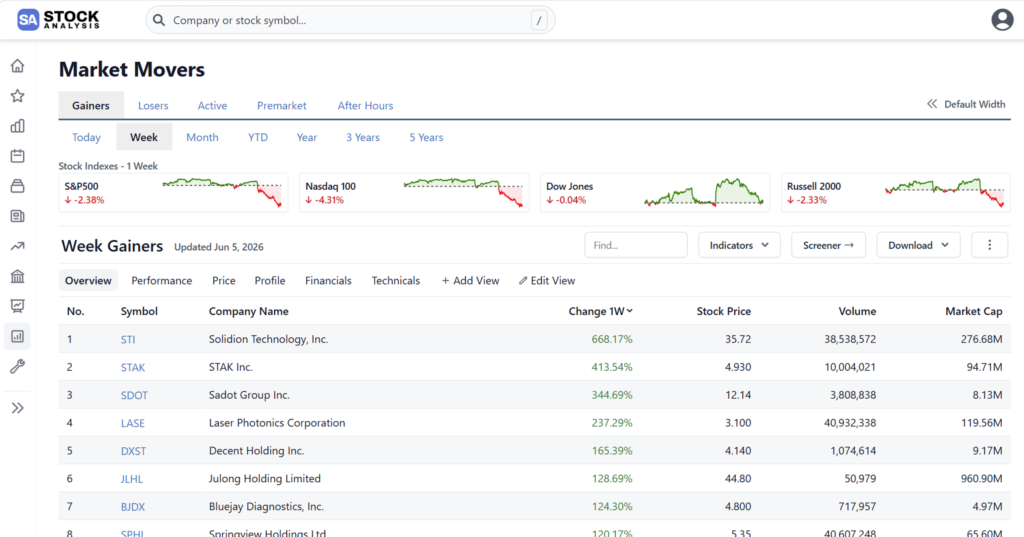
Solidion Technology Inc. ($STI) – a battery technology company that focuses on the development and commercialization of battery materials, components, cells, and selected module/pack technologies.
STAK Inc. Ordinary Shares ($STAK) – engages in the research, development, manufacturing, and sale of oilfield-specialized production and maintenance equipment.
Sadot Group Inc. ($SDOT) – provides supply chain solutions that address growing food security challenges worldwide.
Laser Photonics Corporation ($LASE) – operates as a vertically integrated manufacturing company for photonics-based industrial products and solutions, comprising laser cleaning technologies and applications for the pharmaceutical industry.
Decent Holding Inc. ($DXST) – through its subsidiaries, provides industrial wastewater treatment services in the People’s Republic of China.
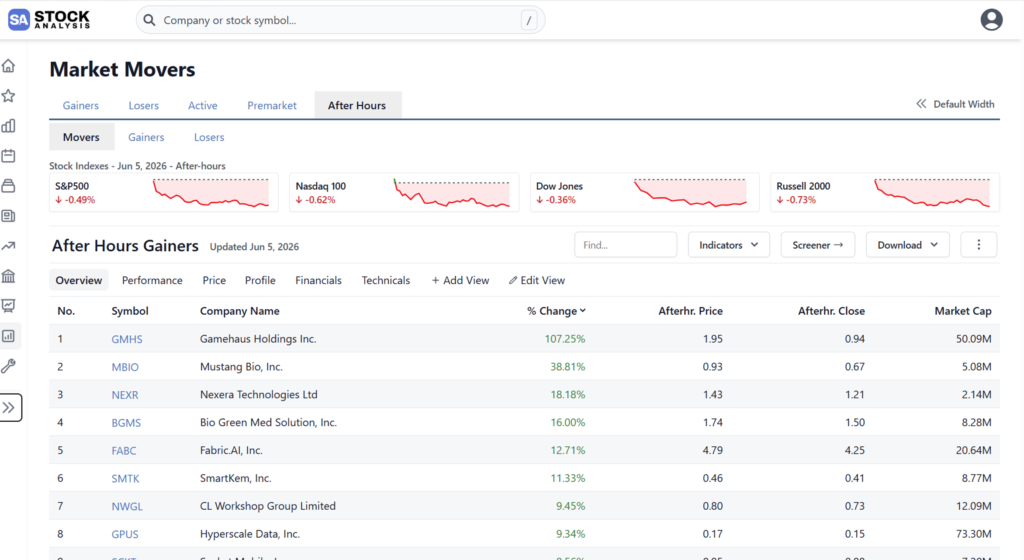
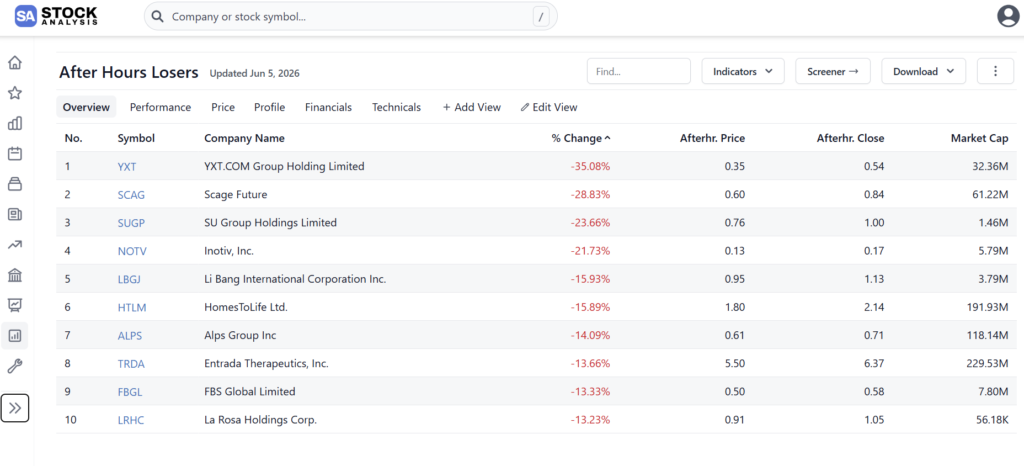
Click on the image or here to see this screen live. You may need to scroll down to see the After Hours losers.
Both gainers and losers are smaller stocks (some even penny stocks). Proceed with caution. These are listed here for informational and educational purposes only. Please consult a financial advisor before making any investing decisions.
We use cookies to ensure that we give you the best experience on our website. If you continue to use this site we will assume that you are happy with it.